• Journal of Resources and Ecology
  • Vol. 11, Issue 6, 539 (2020)
Yang ZHONG1、2, Aiwen LIN1、2、*, Zhigao ZHOU1、2, Lijie HE3, and Moxi YUAN1、2
Author Affiliations
  • 1School of Resource and Environmental Sciences, Wuhan University, Wuhan 430079, China
  • 2The Key Laboratory of Geographic Information System, Wuhan University, Wuhan 430079, China
  • 3Department of Geography and Resource Management, The Chinese University of Hong Kong, Hong Kong 999077, China
  • show less
    DOI: 10.5814/j.issn.1674-764x.2020.06.001 Cite this Article
    Yang ZHONG, Aiwen LIN, Zhigao ZHOU, Lijie HE, Moxi YUAN. Economic Development Status of the Countries along the Belt and Road and Their Correlations with Population and Carbon Emissions[J]. Journal of Resources and Ecology, 2020, 11(6): 539 Copy Citation Text show less
    Annual growth of GDP, population, and carbon emission in the countries along the Belt and Road in 2002-2014.
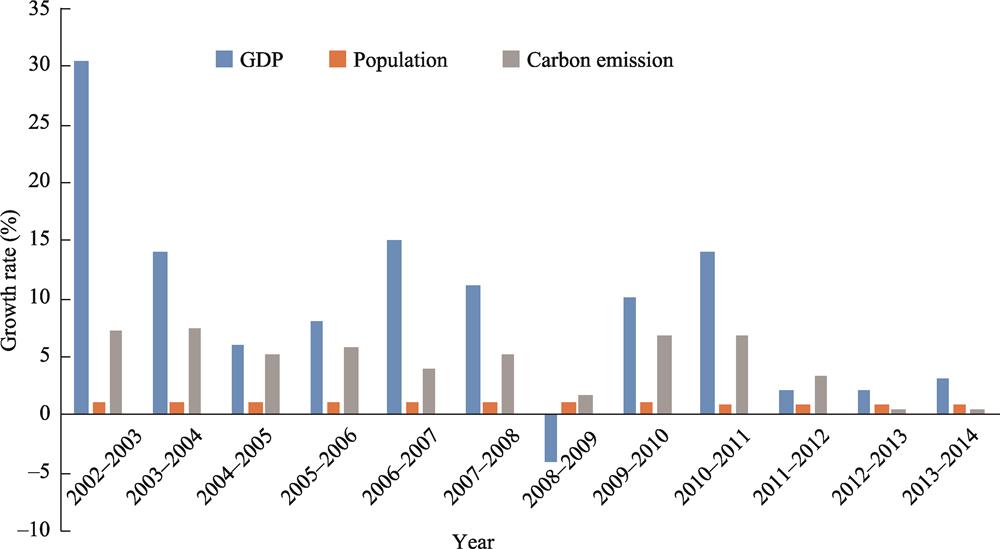
    Fig. 1. Annual growth of GDP, population, and carbon emission in the countries along the Belt and Road in 2002-2014.
    Phase IPhase IIPhase IIIRemarks
    Primary productIndustrializationDeveloped economy
    Production stage IProduction stage IIInitialMedium termLateInitialEra
    100-140140-280280-560560-11201120-21002100-33603360-5040US dollars in 1970
    340-470470-940940-18901890-37703770-70707070-1131011310-16970US dollars in 1990
    393-550550-11001100-22002200-44004400-82508250-1320013200-19800US dollars in 1995
    440-620620-12401240-24902490-49704970-93209320-1491014910-22380US dollars in 2000
    500-710710-14101410-28202820-56405640-1057010570-1692016920-25380US dollars in 2005
    560-790790-15701570-31503150-63006300-1181011810-1890018900-28350US dollars in 2015
    Table 1.

    Criteria for Chennai’s economic development stage divisions

    Economic growth rate>7%5%-7%2%-5%<2%
    Countries and regionsLaos, China, Tajikistan, Afghanistan, Cambodia, Indonesia, Kyrgyzstan, ThailandKazakhstan, Uzbekistan, Bangladesh, Saudi Arabia, Russia, PakistanItaly, Malaysia, Philippines, Sweden, Vietnam, TurkmenistanUnited Kingdom, France, Germany, Singapore, Netherlands, Japan, Iran
    Table 2.

    Classification of economic growth rates along the Belt and Road*

    StageIndustrialization starting stageIndustrial processLate industrialization
    Countries and regionsMyanmar, Cambodia, Laos, Tajikistan, Pakistan, AfghanistanUzbekistan, Vietnam, India, Kyrgyzstan, Bangladesh, Philippines, Turkmenistan, Kazakhstan, Indonesia, Thailand, Iran, ChinaMalaysia, Russia, South Korea, Italy, Saudi Arabia, Netherlands, France, Sweden, Japan, Germany, United Kingdom, Singapore
    Table 3.

    Classification of national industrial competitiveness along the Belt and Road

    Stages of urbanizationFirst level (>70%)Second level (30%-70%)Third level (<30%)
    Countries and regionsSingapore, Japan, Netherlands, Sweden, Saudi Arabia, South Korea, United Kingdom, France, Germany, Malaysia, Russia, IranItaly, China, Kazakhstan, Indonesia, Turkmenistan, Thailand, Philippines, Pakistan, Uzbekistan, Kyrgyzstan, Myanmar, Bangladesh, IndiaTajikistan, Afghanistan, Cambodia
    Table 4.

    Stages of urbanization along the Belt and Road*

    YearsGDP per capitaExports as a share of GDPService industry added value as a share of GDPIndustrial added value as a share of GDPImports as a share of GDPAgricultural added value as a share of GDPTotal capital formation
    20031.3410.8750.2700.2960.7910.9630.316
    20041.3370.8840.2610.2890.7910.9650.317
    20051.2960.9000.2530.2850.7780.9830.281
    20061.2670.9020.2530.2870.7720.9900.287
    20071.2580.8710.2510.2790.7310.9810.292
    20081.2290.9170.2520.2830.7830.9880.271
    20091.2230.8740.2420.2890.7350.9980.322
    20101.1810.8810.2480.2900.7391.0060.305
    20111.1580.8560.2580.3010.7240.9930.333
    20121.1590.8550.2510.2930.7120.9750.364
    20131.1560.8490.2370.2720.7090.9510.347
    20141.1590.8550.2310.2650.7060.9380.322
    Table 5.

    Coefficients of variation for some economic indicators of the countries along the Belt and Road from 2003 to 2014

    Countries20022014Average annual growth rate (%)
    GDP(×108 USD)Population(×104 person)Carbon emission(×104 t)GDP(×108 USD)Population(×104 person)Carbon emission(×104 t)GDPPopulationCarbon emission
    Afghanistan40.552260.08107.08204.853337.08980.9231.173.6762.78
    Bangladesh547.2413247.813370.711728.8515452.027318.9716.611.289.01
    China14705.50128040385026.93104385.29136427.001029192.6946.910.5012.87
    Germany20791.368248.8582972.4838987.278098.2571988.346.73-0.14-1.02
    France14942.876180.5337507.5428521.666631.6130327.566.990.56-1.47
    United Kingdom17730.165937.0552864.2130347.296461.3241982.025.470.68-1.58
    Indonesia1956.6121735.7830673.728908.1525512.9046417.6227.331.343.95
    India5149.38109331.72105425.8820391.27129560.42223837.7122.771.428.64
    Iran1286.276728.4840176.024344.757746.5864948.0718.291.164.74
    Italy12665.115705.9045261.0521517.336078.9132041.155.380.50-2.25
    Japan41151.1612744.50122004.7648504.1412727.60121404.841.37-0.01-0.04
    Kazakhstan246.371485.8913373.552214.161728.8324831.4661.441.266.59
    Kyrgyzstan16.06499.07495.7874.68583.55960.7528.091.307.21
    Cambodia42.841263.77220.75167.031527.45668.4922.301.6015.60
    South Korea6090.204764.4746563.2014113.345074.6758715.6410.130.502.01
    Laos17.58549.32115.14132.68663.98195.4550.361.615.37
    Myanmar67.784770.22920.78654.465228.082163.1666.590.7410.38
    Malaysia1008.452420.8413374.283380.622986.6624282.1418.091.806.27
    Netherlands4716.141614.8918166.328909.811686.5016730.326.840.34-0.61
    Pakistan723.0714954.9711408.402443.6119530.6816629.8518.302.353.52
    Philippines813.588136.537133.782845.8510051.3110565.3619.211.813.70
    Russia3454.7014530.60155708.5220599.8414381.97170534.5738.18-0.080.73
    Saudi Arabia1896.062180.5332640.707563.503091.7060104.7022.993.216.47
    Singapore925.38417.604723.103148.51546.975637.2818.482.381.49
    Sweden2643.46892.505742.525744.13969.614342.099.020.66-1.88
    Thailand1343.016406.9120832.234073.396843.8731621.2715.640.523.98
    Tajikistan12.21642.69188.1291.13825.28518.8849.712.1913.53
    Turkmenistan44.62461.003996.66435.24546.636842.2667.341.435.48
    Uzbekistan96.882527.1912834.87766.593075.7710521.3653.181.67-1.39
    Vietnam350.648153.447080.611862.059171.4616691.0833.160.9610.44
    Total138093.97396833.121260909.7387061.46446548.652132995.9913.870.965.32
    Table 6.

    Changes of GDP, population and carbon emissions of countries along the Belt and Road in 2002-2014

    Yang ZHONG, Aiwen LIN, Zhigao ZHOU, Lijie HE, Moxi YUAN. Economic Development Status of the Countries along the Belt and Road and Their Correlations with Population and Carbon Emissions[J]. Journal of Resources and Ecology, 2020, 11(6): 539
    Download Citation