
Yang ZHONG, Aiwen LIN, Zhigao ZHOU, Lijie HE, Moxi YUAN. Economic Development Status of the Countries along the Belt and Road and Their Correlations with Population and Carbon Emissions[J]. Journal of Resources and Ecology, 2020, 11(6): 539
- Journal of Resources and Ecology
- Vol. 11, Issue 6, 539 (2020)
Abstract
1 Introduction
At the Bo’ao Forum for Asia in Hainan on March 27, 2015, the National Development and Reform Commission, the Ministry of Foreign Affairs and the Ministry of Commerce jointly issued the “Vision and Action for Promoting the Construction of the Silk Road Economic Belt and the 21st Century Maritime Silk Road” referred to below as just “Vision and Action”. This event marks “The Belt and Road Initiative” officially becoming a national grand strategy of China. The “One Belt, One Road” initiative was born in the context of adjusting the world pattern and economic globalization. The construction of the Belt and Road is an inevitable requirement for implementing a new pattern of all-around opening in China and an inevitable choice for promoting the common development and prosperity of Asian and European countries (
At present, studies of the Belt and Road area have become important research directions in the disciplines of economics, geography, political science, and many others. At the research method level, most of the existing studies have concentrated on the theoretical level (
The geo-economy refers to economic cooperation between countries, regions or ethnic groups based on geographical location, resource endowment, economic structure and other factors, such as cooperation, alliance (economic grouping) or competition, opposition, and even containment (
At present, the academic community has carried out much work related to geo-economics. At the research object level, these efforts have mainly focused on China (
By summarizing the status of the above research, we find that the existing research on regional economic differences mainly focuses on China’s domestic research, and there are few studies on regional economic differences between countries or on the correlations between GDP, population and carbon emissions in large regions. However, due to the differences in resource endowments and location conditions, there are uneven development characteristics among regional economies. Therefore, this paper takes 30 countries along the Belt and Road as the study area, and based on geo-economic and political views, it then applies several mathematical statistical methods. This paper not only analyzes the current economic development level of China and the countries along the route, but also examines the correlations between the three factors of GDP, population and carbon emissions in the countries along the Belt and Road. This investigation not only enriches the research content of the Belt and Road on the theoretical level, but also has certain practical significance. In addition, according to the results of this study, we not only discover the economic development characteristics and differences among the countries along the Belt and Road, but also determine the changes and correlation degrees of the three factors of GDP, population and carbon emissions in these countries during the study period. Therefore, the findings of this study can provide certain guidance for the deepening development, prosperity, stability and sustainable development of the Belt and Road, and therefore it has a certain practical value.
2 Research area, data sources and research methods
2.1 Research area and data sources
Because the Belt and Road covers a wide geographical range and includes many countries, those with smaller economies have less impact on the overall strategy. Therefore, this paper selects a total of 30 countries and regions: including China, Japan, South Korea, Sweden, the Netherlands, Germany, France, United Kingdom, Thailand, Vietnam, Laos, India, Myanmar, Cambodia, Philippines, Italy, Russia, Singapore, Afghanistan, Malaysia as those with the highest economic scale along the Belt and Road; along with Pakistan, Bangladesh, Uzbekistan, Tajikistan, Kyrgyzstan, Turkmenistan, Kazakhstan, Saudi Arabia, Indonesia, Iran. This study covers the major countries of the Shanghai Cooperation Organization and the Association of Southeast Asian Nations. The European countries selected are the main economies at the western end of the Eurasian Continental Bridge, which completes the coverage of both ends of the Eurasian continent.
The main data source used in this paper is the World Bank statistics for 2004-2014, while Indonesia’s foreign exchange reserve data are from Sina Finance. The value added of agriculture, industrial added value, and the value added for the service industry as a percentage of GDP are calculated in accordance with the International Standard Industrial Classification (
2.2 Research methods
2.2.1 Coefficient of variation
The coefficient of variation, also known as the “standard deviation rate”, is one of the most commonly used statistics for measuring the degree of variation in each parameter. The coefficient of variation is a normalized measure of the degree of dispersion of the probability distribution, which is defined as the ratio of the standard deviation to the mean. It is expressed by
In the formula,
2.2.2 Principal Component Analysis
This method is a dimensionality reduction multivariate statistical analysis method. It converts a set of original variables into another set of a much smaller number of new variables without reducing the total variance of the original indicators. Therefore, the new variables can comprehensively reflect the variation of the original variables. This method is used here to calculate the comprehensive differences in the economic development levels of various economies in the China-ASEAN Free Trade Area. Among them, the indicator of economic growth scale is per capita GDP, and the indicators reflecting the economic structure are 1) the proportions of industrial added value and the added value of the tertiary industry, 2) the inflation rate reflecting the overall level of prices and the level of urbanization which reflects the urban construction situation, and 3) the indicator of the degree of economic extroversion which reflects the proportion of imports and exports (
3 Characteristics and differences in economic development among the countries along the Belt and Road
3.1 The economic development trends of the countries along the Belt and Road
The per capita GDP indicator reflects the per capita economic aggregate of a country or region. The magnitude of its value reflects the productivity status and economic development level of a country. The stage of economic development is an important part of a countrys national conditions or a regional situation. Judging the stage of economic development of a country or a region is one of the important prerequisites for that country or region to formulate a sound economic development strategy and promote economic development.
In 2014, the per capita GDP of the countries in the study area varied greatly, with Sweden, Singapore, and the Netherlands exceeding US$50000, while Afghanistan was less than US$1000. According to the classification criteria of economically developed countries, the countries in the region can be divided into four levels. Eleven countries are at the first level, including Sweden and Singapore. These countries have entered the ranks of the world’s developed countries. They have high economic development levels, advanced infrastructure, perfect social security systems and good living conditions for the people. The second level includes Kazakhstan and other seven countries. Their incomes are at the middle level globally, and they are mainly regions with better economic development than developing countries. Their politics are relatively stable, their food supply is self-sufficient, and the proportion of absolute poverty is small. Only Iran and Thailand are in poor states of development. The third level includes five countries, such as Indonesia. The people’s lifestyle in these countries and regions is at a lower level overall, the infrastructure is poor, the people lack perfect social security, and poverty and a poor living environment are common characteristics of these countries. However, India has a large population size and a complete industrial system, and it even ranks among the world’s leaders in some industries. The fourth level includes seven countries and regions such as Pakistan, which have poor geographical conditions and low levels of productivity, and they are at the bottom of the international division of labor.
According to the standard of economic development, although the differences in economic development can be seen, and it is impossible to judge the economic development stage of each economy, so this study uses the grading standard for industrialization phases from the book “Com- parative Study of Industrialization and Economic Growth” by
the division of countries and regions in this study are shown in
| Phase I | Phase II | Phase III | Remarks | ||||
|---|---|---|---|---|---|---|---|
| Primary product | Industrialization | Developed economy | |||||
| Production stage I | Production stage II | Initial | Medium term | Late | Initial | Era | |
| 100-140 | 140-280 | 280-560 | 560-1120 | 1120-2100 | 2100-3360 | 3360-5040 | US dollars in 1970 |
| 340-470 | 470-940 | 940-1890 | 1890-3770 | 3770-7070 | 7070-11310 | 11310-16970 | US dollars in 1990 |
| 393-550 | 550-1100 | 1100-2200 | 2200-4400 | 4400-8250 | 8250-13200 | 13200-19800 | US dollars in 1995 |
| 440-620 | 620-1240 | 1240-2490 | 2490-4970 | 4970-9320 | 9320-14910 | 14910-22380 | US dollars in 2000 |
| 500-710 | 710-1410 | 1410-2820 | 2820-5640 | 5640-10570 | 10570-16920 | 16920-25380 | US dollars in 2005 |
| 560-790 | 790-1570 | 1570-3150 | 3150-6300 | 6300-11810 | 11810-18900 | 18900-28350 | US dollars in 2015 |
Table 1.
Criteria for Chennai’s economic development stage divisions
3.2 The unbalanced economic growth rate along the line
The economic development potential of a country can be measured by the speed of its economic growth. The standard of living of a country depends on its ability to produce and deliver products and services, which is also achieved through long-term stable economic growth.
| Economic growth rate | >7% | 5%-7% | 2%-5% | <2% |
|---|---|---|---|---|
| Countries and regions | Laos, China, Tajikistan, | Kazakhstan, Uzbekistan, | Italy, Malaysia, Philippines, Sweden, Vietnam, | United Kingdom, France, |
Table 2.
Classification of economic growth rates along the Belt and Road*
First,
3.3 Variations in industrial competitiveness
The regional industrial structure is the framework for regional implementation and resource allocation. Under the premise of the economic system and enterprise efficiency, the efficiency and development of regional economic growth depend to a large extent on the advanced nature and changes in the regional industrial structure. The transformation of the industrial structure is a core variable for understanding the difference between economic development in developing countries and developed countries, and it is also the essential requirement for allowing late-developing countries to accelerate their economic development. The evolution of industrial structure is a process of continuously improving the labor productivity, and different industrial structures reflect the quality of economic growth in a region. According to the proportions of the added value of the three industries to GDP, the countries along the Belt and Road can be divided into three types based on their national industrial competitiveness (
| Stage | Industrialization starting stage | Industrial process | Late industrialization |
|---|---|---|---|
| Countries and | Myanmar, Cambodia, Laos, | Uzbekistan, Vietnam, India, Kyrgyzstan, Bangladesh, Philippines, Turkmenistan, | Malaysia, Russia, South Korea, Italy, Saudi Arabia, Netherlands, France, Sweden, Japan, |
Table 3.
Classification of national industrial competitiveness along the Belt and Road
3.4 Countries along “The Belt and Road Initiative” Region are in different stages of urbanization
The city is a congregation of residents with a certain population size and a mainly non-agricultural population. The town is a major venue for economic, political and cultural activities, and provides products and services. Therefore, improving the level of urbanization is also an important factor in a country's economic development, social progress, and productivity levels, and the world has entered the stage of comprehensive urbanization. The American geographer Northam proposed the S-shaped law of urbanization in 1975. By studying the changes in the proportion of urban population in the total population of each country, he found that the urbanization process was staged and the whole process presented a slightly flattened S-curve. Therefore, in order to more clearly understand the urbanization stages of the countries along the Belt and Road, we statistically analyzed the urbanization stages of these countries. The specific statistical results are shown in
| Stages of urbanization | First level (>70%) | Second level (30%-70%) | Third level (<30%) |
|---|---|---|---|
| Countries and regions | Singapore, Japan, Netherlands, Sweden, Saudi Arabia, South Korea, United Kingdom, France, Germany, Malaysia, Russia, Iran | Italy, China, Kazakhstan, Indonesia, Turkmenistan, Thailand, Philippines, Pakistan, Uzbekistan, Kyrgyzstan, Myanmar, Bangladesh, India | Tajikistan, |
Table 4.
Stages of urbanization along the Belt and Road*
3.5 Economic development differences based on the coefficient of variation
By calculating the coefficient of variation of selected indicators from 2003-2014 in the study area, the variations of internal differences in the 30 countries along the Belt and Road can be obtained. The coefficients of variation for some economic indicators of the countries along the Belt and Road from 2003 to 2014 are shown in
| Years | GDP per capita | Exports as a share of GDP | Service industry added value as a share of GDP | Industrial added value as a share of GDP | Imports as a share of GDP | Agricultural added value as a share of GDP | Total capital formation |
|---|---|---|---|---|---|---|---|
| 2003 | 1.341 | 0.875 | 0.270 | 0.296 | 0.791 | 0.963 | 0.316 |
| 2004 | 1.337 | 0.884 | 0.261 | 0.289 | 0.791 | 0.965 | 0.317 |
| 2005 | 1.296 | 0.900 | 0.253 | 0.285 | 0.778 | 0.983 | 0.281 |
| 2006 | 1.267 | 0.902 | 0.253 | 0.287 | 0.772 | 0.990 | 0.287 |
| 2007 | 1.258 | 0.871 | 0.251 | 0.279 | 0.731 | 0.981 | 0.292 |
| 2008 | 1.229 | 0.917 | 0.252 | 0.283 | 0.783 | 0.988 | 0.271 |
| 2009 | 1.223 | 0.874 | 0.242 | 0.289 | 0.735 | 0.998 | 0.322 |
| 2010 | 1.181 | 0.881 | 0.248 | 0.290 | 0.739 | 1.006 | 0.305 |
| 2011 | 1.158 | 0.856 | 0.258 | 0.301 | 0.724 | 0.993 | 0.333 |
| 2012 | 1.159 | 0.855 | 0.251 | 0.293 | 0.712 | 0.975 | 0.364 |
| 2013 | 1.156 | 0.849 | 0.237 | 0.272 | 0.709 | 0.951 | 0.347 |
| 2014 | 1.159 | 0.855 | 0.231 | 0.265 | 0.706 | 0.938 | 0.322 |
Table 5.
Coefficients of variation for some economic indicators of the countries along the Belt and Road from 2003 to 2014
Except for the narrowing trend of the per capita GDP index in recent years, there are no obvious convergence trends for any of the other indicators. Therefore, the promotion of the Belt and Road initiative must take into account different levels of economic development, political systems, resources and environment, social systems, cultural traditions, and religious beliefs.
4 Correlation analysis of national GDP, population and carbon emissions along the Belt and Road
4.1 Trends in GDP, population and carbon emission in countries along the Belt and Road
Considering the availability of data, this study selects the period from 2002 to 2014, and summarizes the GDP, population and carbon emissions data for the countries along the Belt and Road. In addition, the average annual growth rates of these three values in 2002-2014 are also summarized. The specific statistical results are shown in
In terms of Population, as of 2014, the top five countries by population are China, India, Indonesia, Pakistan and Bangladesh, and the other countries in the study area also have relatively large populations. Therefore, we can find that the countries along the Belt and Road include those with some of the largest populations in the world, indicating a sufficient population base and consumption potential. In addition, except for the negative population growth in Germany, Japan and Russia, the populations of the remaining 27 countries in the study area showed positive growth. The top five countries with the largest population growth rates were Afghanistan (3.67%), Saudi Arabia (3.21%), Singapore (2.38%), Pakistan (2.35%) and Tajikistan (2.19%). These countries are mainly located in the Central Asia, West Asia and Southeast Asia regions of the Belt and Road. At the same time, the current populations of these countries are relatively small compared to others in the region, reflecting the fact that the population growth in the study area tends to be reasonable and the population distribution is continuously being optimized.
| Countries | 2002 | 2014 | Average annual growth rate (%) | ||||||
|---|---|---|---|---|---|---|---|---|---|
| GDP | Population | Carbon emission | GDP | Population | Carbon emission | GDP | Population | Carbon emission | |
| Afghanistan | 40.55 | 2260.08 | 107.08 | 204.85 | 3337.08 | 980.92 | 31.17 | 3.67 | 62.78 |
| Bangladesh | 547.24 | 13247.81 | 3370.71 | 1728.85 | 15452.02 | 7318.97 | 16.61 | 1.28 | 9.01 |
| China | 14705.50 | 128040 | 385026.93 | 104385.29 | 136427.00 | 1029192.69 | 46.91 | 0.50 | 12.87 |
| Germany | 20791.36 | 8248.85 | 82972.48 | 38987.27 | 8098.25 | 71988.34 | 6.73 | -0.14 | -1.02 |
| France | 14942.87 | 6180.53 | 37507.54 | 28521.66 | 6631.61 | 30327.56 | 6.99 | 0.56 | -1.47 |
| United Kingdom | 17730.16 | 5937.05 | 52864.21 | 30347.29 | 6461.32 | 41982.02 | 5.47 | 0.68 | -1.58 |
| Indonesia | 1956.61 | 21735.78 | 30673.72 | 8908.15 | 25512.90 | 46417.62 | 27.33 | 1.34 | 3.95 |
| India | 5149.38 | 109331.72 | 105425.88 | 20391.27 | 129560.42 | 223837.71 | 22.77 | 1.42 | 8.64 |
| Iran | 1286.27 | 6728.48 | 40176.02 | 4344.75 | 7746.58 | 64948.07 | 18.29 | 1.16 | 4.74 |
| Italy | 12665.11 | 5705.90 | 45261.05 | 21517.33 | 6078.91 | 32041.15 | 5.38 | 0.50 | -2.25 |
| Japan | 41151.16 | 12744.50 | 122004.76 | 48504.14 | 12727.60 | 121404.84 | 1.37 | -0.01 | -0.04 |
| Kazakhstan | 246.37 | 1485.89 | 13373.55 | 2214.16 | 1728.83 | 24831.46 | 61.44 | 1.26 | 6.59 |
| Kyrgyzstan | 16.06 | 499.07 | 495.78 | 74.68 | 583.55 | 960.75 | 28.09 | 1.30 | 7.21 |
| Cambodia | 42.84 | 1263.77 | 220.75 | 167.03 | 1527.45 | 668.49 | 22.30 | 1.60 | 15.60 |
| South Korea | 6090.20 | 4764.47 | 46563.20 | 14113.34 | 5074.67 | 58715.64 | 10.13 | 0.50 | 2.01 |
| Laos | 17.58 | 549.32 | 115.14 | 132.68 | 663.98 | 195.45 | 50.36 | 1.61 | 5.37 |
| Myanmar | 67.78 | 4770.22 | 920.78 | 654.46 | 5228.08 | 2163.16 | 66.59 | 0.74 | 10.38 |
| Malaysia | 1008.45 | 2420.84 | 13374.28 | 3380.62 | 2986.66 | 24282.14 | 18.09 | 1.80 | 6.27 |
| Netherlands | 4716.14 | 1614.89 | 18166.32 | 8909.81 | 1686.50 | 16730.32 | 6.84 | 0.34 | -0.61 |
| Pakistan | 723.07 | 14954.97 | 11408.40 | 2443.61 | 19530.68 | 16629.85 | 18.30 | 2.35 | 3.52 |
| Philippines | 813.58 | 8136.53 | 7133.78 | 2845.85 | 10051.31 | 10565.36 | 19.21 | 1.81 | 3.70 |
| Russia | 3454.70 | 14530.60 | 155708.52 | 20599.84 | 14381.97 | 170534.57 | 38.18 | -0.08 | 0.73 |
| Saudi Arabia | 1896.06 | 2180.53 | 32640.70 | 7563.50 | 3091.70 | 60104.70 | 22.99 | 3.21 | 6.47 |
| Singapore | 925.38 | 417.60 | 4723.10 | 3148.51 | 546.97 | 5637.28 | 18.48 | 2.38 | 1.49 |
| Sweden | 2643.46 | 892.50 | 5742.52 | 5744.13 | 969.61 | 4342.09 | 9.02 | 0.66 | -1.88 |
| Thailand | 1343.01 | 6406.91 | 20832.23 | 4073.39 | 6843.87 | 31621.27 | 15.64 | 0.52 | 3.98 |
| Tajikistan | 12.21 | 642.69 | 188.12 | 91.13 | 825.28 | 518.88 | 49.71 | 2.19 | 13.53 |
| Turkmenistan | 44.62 | 461.00 | 3996.66 | 435.24 | 546.63 | 6842.26 | 67.34 | 1.43 | 5.48 |
| Uzbekistan | 96.88 | 2527.19 | 12834.87 | 766.59 | 3075.77 | 10521.36 | 53.18 | 1.67 | -1.39 |
| Vietnam | 350.64 | 8153.44 | 7080.61 | 1862.05 | 9171.46 | 16691.08 | 33.16 | 0.96 | 10.44 |
| Total | 138093.97 | 396833.12 | 1260909.7 | 387061.46 | 446548.65 | 2132995.99 | 13.87 | 0.96 | 5.32 |
Table 6.
Changes of GDP, population and carbon emissions of countries along the Belt and Road in 2002-2014
In terms of Carbon emission, as of 2014, the top five countries in terms of carbon emissions are China, India, Russia, Japan and Germany. In addition, Germany, France, United Kingdom, Italy, Japan, Netherlands, Sweden and Uzbekistan each showed negative growth in their carbon emissions, reflecting the effectiveness of these countries in energy conservation and emission reduction, and they mainly are developed countries. Among the 22 countries with positive increases in carbon emissions, the top five countries in terms of carbon emissions growth were Afghanistan (62.78%), Cambodia (15.60%), Tajikistan (13.53%), China (12.87%), and Vietnam (10.44%). These are all developing countries, their economic development mode is relatively extensive, and their resource utilization efficiency is low. Therefore, these countries need to gradually transform the industrial development model, introduce advanced science and technology, and vigorously promote energy-saving emission reduction and cleaner production.
4.2 Correlation analysis of GDP, population and carbon emissions along the Belt and Road
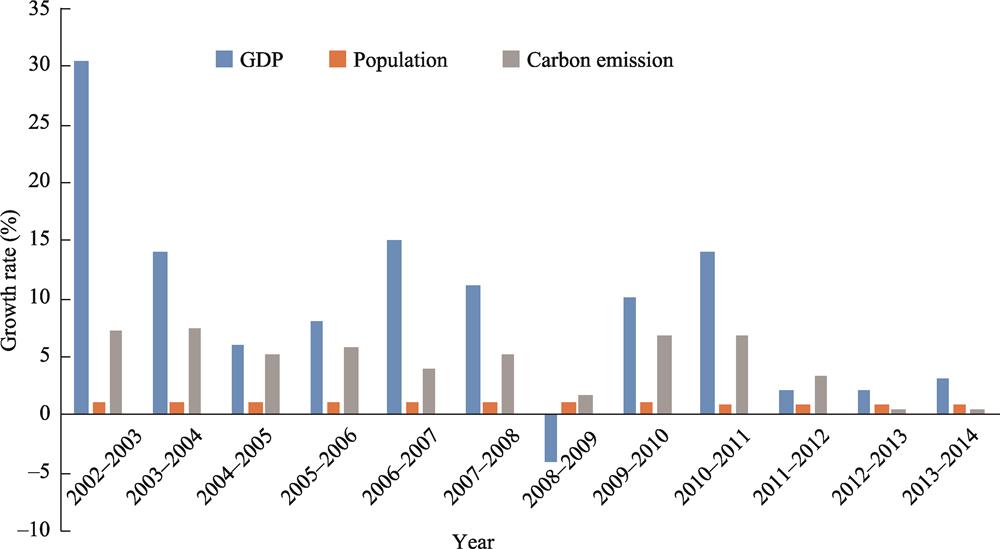
Before conducting the regression analysis, we conducted a correlation analysis in order to explore the correlations between the three factors of GDP, population and carbon emissions in the countries along the Belt and Road. The correlation coefficient between GDP and population of the countries along the Belt and Road is 0.989, while the correlation coefficient between GDP and carbon emissions is 0.995, and the correlation coefficient between population and carbon emissions is 0.993. These values show that the correlations between the three factors of GDP, population and carbon emissions are very high. Among them, GDP has the highest correlation with carbon emissions, reaching 0.995, because the industrial production that produces carbon emissions is one of the most important sources of GDP. In addition, the degree of correlation between population and GDP is also very high, reaching 0.989, because the population reflects the consumer group and motivation is one of the main drivers of GDP growth. In order to more clearly reveal the detailed changes in the three values of GDP, population and carbon emissions in the countries along the Belt and Road from 2002 to 2014 the graph plotted in
![]()
Figure 1.
5 Discussion
Due to the large differences in economic development levels among the Belt and Road countries, the list includes not only developed industrialized countries but also underdeveloped agricultural countries. At the same time, the Belt and Road countries have different national conditions, and there are still many contradictions within and between these countries. Therefore, in order to realize the full development of the One Belt, One Road initiative, each of the countries must profoundly recognize that development is the first priority and they need to achieve a common development level based on the principle of mutual benefit and win-win. Specifically, countries with more developed economies should increase investment and construction in the less-developed countries, while the countries with less developed economies should also increase the introduction of capital and advanced technologies from the developed countries. In terms of carbon emissions, countries should strive to reach more stringent agreements and develop high-efficiency, low-energy, clean production. Some disputes should also be resolved by peaceful negotiations. In addition, countries along “The Belt and Road Initiative” should also increase exchanges and interactions in the realms of culture, tourism and education.
At present, China’s economic development has entered a new era, and its total economic output has jumped to the second place in the world. However, China’s per capita national income is still in the middle and lower reaches of the world, the development gaps between different regions in China are large, and the quality of urbanization is not high. In the traditional manufacturing industry, due to the rising costs of raw materials and various labor factors, the sustainable development of the economy faces a huge dilemma. At the same time, China already possesses a number of world-class technologies such as aerospace, electronic information, high-speed railway and deep-sea development. Therefore, in the construction of the Belt and Road, it is necessary to consider the development characteristics of the different countries and the complementarity between these countries and the Chinese economy. In addition, economic cooperation with developed countries should focus on high-tech scientific and technological cooperation and promote cooperation between the developing countries to transfer domestic traditions. At the same time, “The Belt and Road Initiative” strategy aims to achieve the deepening and expansion of China’s opening up strategy in the new era. In the process of promoting the sustainable development of the Belt and Road strategy initiative, we must also pay attention to cooperation with domestic regional development strategies.
6 Conclusions
Through this research, we found that the per capita GDP of countries in the study region along the Belt and Road varies widely. Aside from the negative growth of Iran’s economy, the economies of the other countries have increased to varying degrees. In addition, the economic growth rates of Asian developing countries are generally higher than those of developed European countries. The annual coefficients of variation of per capita GDP indicators in the study area are greater than 1, indicating that the Belt and Road is the framework for regional cooperation between developed and developing countries. These contradictions need to be overcome. In terms of the correlations between GDP and population and carbon emissions between 2002 and 2014, for most countries along “The Belt and Road Initiative” each of these measures continued to increase. The correlation coefficient between GDP and population along the Belt and Road is 0.989, the correlation coefficient between GDP and carbon emissions is 0.995, and the correlation coefficient between population and carbon emissions is 0.993. Thus, the correlations between GDP, population and carbon emissions are very high. Among them, GDP has the highest correlation with carbon emissions, reaching 0.995. The regression analysis showed that the value of
References
[1] AndrzejB, ZdzislawS. Global aspects of security environment—The “One Belt, One Road” project. Ekonomia I Prawo-Economics and Law, 15, 439-454(2016).
[3] Chennai HB, RobinsonX, SerkiyM. Comparative study of industrialization and economic growth(1989).
[4] CocciaM, FinardiU, MargonD. Current trends in nanotechnology research across worldwide geo-economic players. Journal of Technology, 37, 777-787(2012).
[7] Hu BL. The one Belt and one Road: Initiative, implementation and prospects. Chinese Journal Population Science, 38, 1-18(2018).
[9] Jiang JD, Zhao XY, Zhang FY. Matching analysis of foreign economic linkage and geo-economic relationship between Hefei and Wuhu City, Anhui Province. Resources and Environment in the Yangtze River Basin, 21, 137-144(2012).
[10] KundnaniH. Germany as a geo-economic power. Washington Quarterly, 34, 31-45(2011).
[22] PengF, YangX, Liu TB et al. Spatial differentiation of the advantages of geo-economic system development in China’s border areas. Economic Geography, 39, 19-26(2019).
[24] Su DH, Luo HS, Cai DK. Measurement and analysis of the geo-economic relationship between large countries and southeast Asia. World Geography Research, 22, 1-11(2013).
[27] Xu LY, Wu LP. Economic links and geo-economic relations between cities in the Beibu Gulf urban agglomeration. Urban Problem, 35, 59-64(2016).
[29] Yang SL. Governance and challenges of China’s relations with countries along the Belt and Road Initiative. South Asian Studies, 35, 15-34(2015).
[31] Yuan XT. National strategy analysis of the “Belt and Road” construction. Theoretical Monthly, 28, 5-9(2014).
[33] Zhang HZ, Wu YD, Wang YC et al. Study on the matching of spatial economic relations and geo-economic relations of urban agglomeration in central Guizhou. Regional Research and Development, 33, 16-19(2014).
[34] Zhao MH, Li JJ, Han RQ et al. Study on the inter-provincial geo-economic relationship in the Bohai Rim Region. Economic Geography, 35, 29-35(2015).
[35] Zhao YB, Hu ZD, Ge YJ et al. Temporal and spatial evolution and type division of geo-economic correlation between China and Central Asia. World Geography Research, 28, 105-113(2019).


Set citation alerts for the article
Please enter your email address

© Copyright 2018-2021 | Chinese Laser Press. All Rights Reserved 沪ICP备15018463号-20