• Spectroscopy and Spectral Analysis
  • Vol. 42, Issue 5, 1541 (2022)
Yan-ru WANG*, Hai-jun TANG*;, and Yao ZHANG
Author Affiliations
  • Aviation Safety Technology Institute, China Academy of Civil Aviation Science & Technology, Beijing 100028, China
  • show less
    DOI: 10.3964/j.issn.1000-0593(2022)05-1541-06 Cite this Article
    Yan-ru WANG, Hai-jun TANG, Yao ZHANG. Study on Infrared Spectral Detection of Fuel Contamination in Mobil Jet Oil II Lubricating Oil[J]. Spectroscopy and Spectral Analysis, 2022, 42(5): 1541 Copy Citation Text show less
    Schematic diagram of the test process
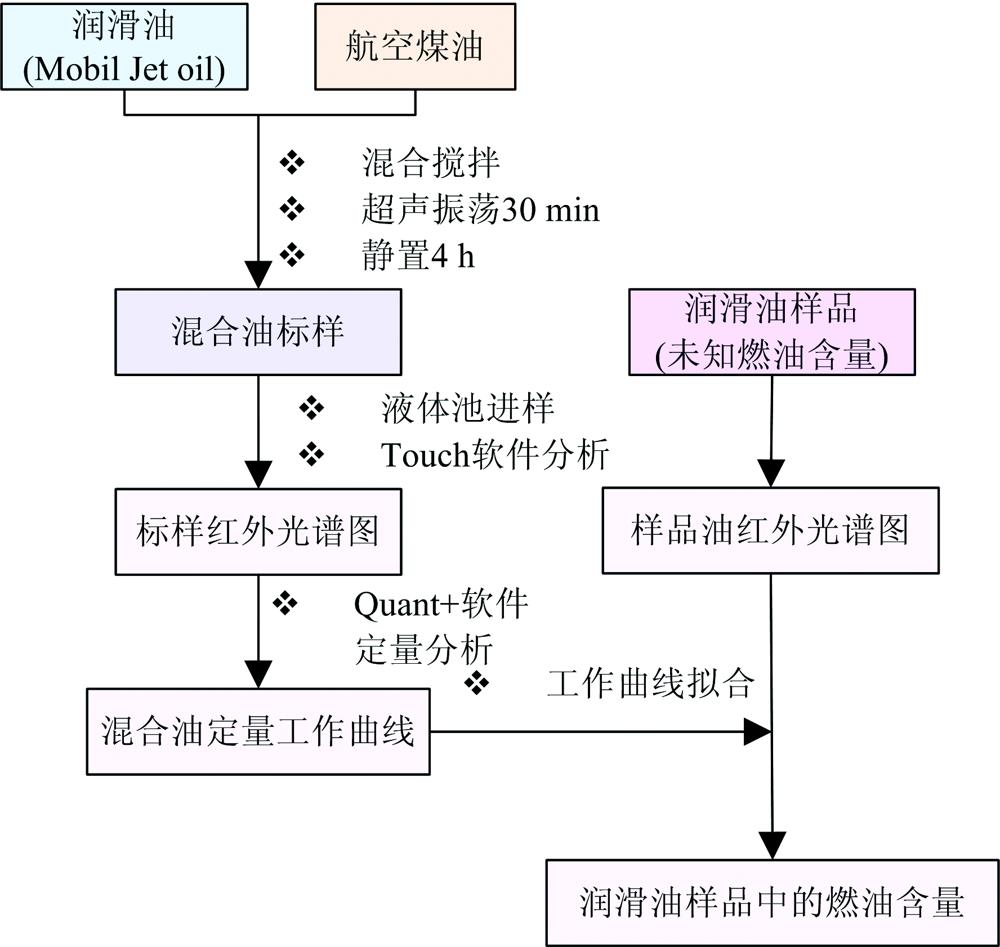
    Fig. 1. Schematic diagram of the test process
    Infrared spectra of Mobil Jet oil Ⅱ lubricating oil, fuel oil and lubricating oil mixed with 50% fuel oil
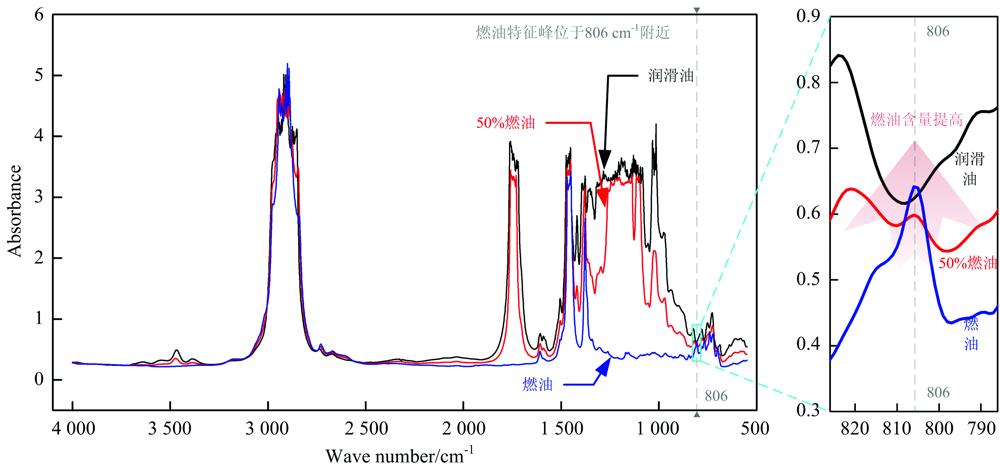
    Fig. 2. Infrared spectra of Mobil Jet oil Ⅱ lubricating oil, fuel oil and lubricating oil mixed with 50% fuel oil
    (a) Infrared spectra of lubricating oil samples mixed with different fuel contents; (b) characteristic region area of the sample with 0% fuel content; (c) characteristic region area of the sample with 2% fuel content; (d) characteristic region area of the sample with 3% fuel content; (e) characteristic region area of the sample with 5% fuel content; (f) characteristic region area of the sample with 10% fuel content; (g)characteristic region area of the sample with 25% fuel content
    Fig. 3. (a) Infrared spectra of lubricating oil samples mixed with different fuel contents; (b) characteristic region area of the sample with 0% fuel content; (c) characteristic region area of the sample with 2% fuel content; (d) characteristic region area of the sample with 3% fuel content; (e) characteristic region area of the sample with 5% fuel content; (f) characteristic region area of the sample with 10% fuel content; (g)characteristic region area of the sample with 25% fuel content
    Working curve fitting using Spectrum Quant software
    Fig. 4. Working curve fitting using Spectrum Quant software
    扫描范围/cm-1光谱分辨率/cm-1波长精度/cm-1信噪比
    8 300~350优于0.50.0150 000:1
    Table 1. Infrared spectrometer parameters
    实际值/%预测值/%残差/%偏差/%
    0.80.810.011.25
    1.21.210.010.83
    44.0000
    Table 2. Forecast results of working curve
    实际值
    /%
    预测值/%平均值
    /%
    SD
    标准偏差
    0.81.000.740.770.790.810.820.09
    1.21.211.131.231.161.211.190.04
    44.144.004.003.974.054.030.06
    Table 3. Repeated determination results
    序号特征谱区面积序号特征谱区面积
    1-0.759-0.75
    2-0.7410-0.75
    3-0.7511-0.75
    4-0.7512-0.75
    5-0.7513-0.75
    6-0.7514-0.75
    7-0.7515-0.75
    8-0.7516-0.75
    Table 4. Blank fuel peak area
    样品编号红外光谱工作
    曲线法/%
    燃油嗅探仪/%两种方法
    相对误差/%
    10.500.500
    20.780.9013.33
    32.633.0012.33
    48.708.801.14
    Table 5. Fuel quantitative results of the two detection methods
    Yan-ru WANG, Hai-jun TANG, Yao ZHANG. Study on Infrared Spectral Detection of Fuel Contamination in Mobil Jet Oil II Lubricating Oil[J]. Spectroscopy and Spectral Analysis, 2022, 42(5): 1541
    Download Citation