• Photonics Research
  • Vol. 12, Issue 2, 313 (2024)
Jindong Wang1、2、3、†, Jingsheng Huang1、†, Qihua Liu2、†, Wei Du1, Fumin Zhang2, and Tao Zhu1、*
Author Affiliations
  • 1Key Laboratory of Optoelectronic Technology & Systems (Ministry of Education), Chongqing University, Chongqing 400044, China
  • 2State Key Laboratory of Precision Measuring Technology & Instruments, Tianjin University, Tianjin 300072, China
  • 3e-mail: jdwang@cqu.edu.cn
  • show less
    DOI: 10.1364/PRJ.506474 Cite this Article Set citation alerts
    Jindong Wang, Jingsheng Huang, Qihua Liu, Wei Du, Fumin Zhang, Tao Zhu. Linear group delay spectral interferometry for full-range precision absolute length metrology[J]. Photonics Research, 2024, 12(2): 313 Copy Citation Text show less
    Existing issues associated with the conventional SPI length metrology. (a) The periodic ambiguities and the dead zones due to inadequate sampling rate and the data characteristics, which collectively result in the presence of prolonged un-measurable areas, marked with light purple. (b) The FFT spectra of interference data, where the Nyquist frequency limits the measurable region, marked in light blue. (c) and (d) Unmeasurable regions near the minimum and the maximum positions. An, Bn, and Cn are representative positions to be measured. UMR, unmeasurable region; FFT, fast Fourier transform.
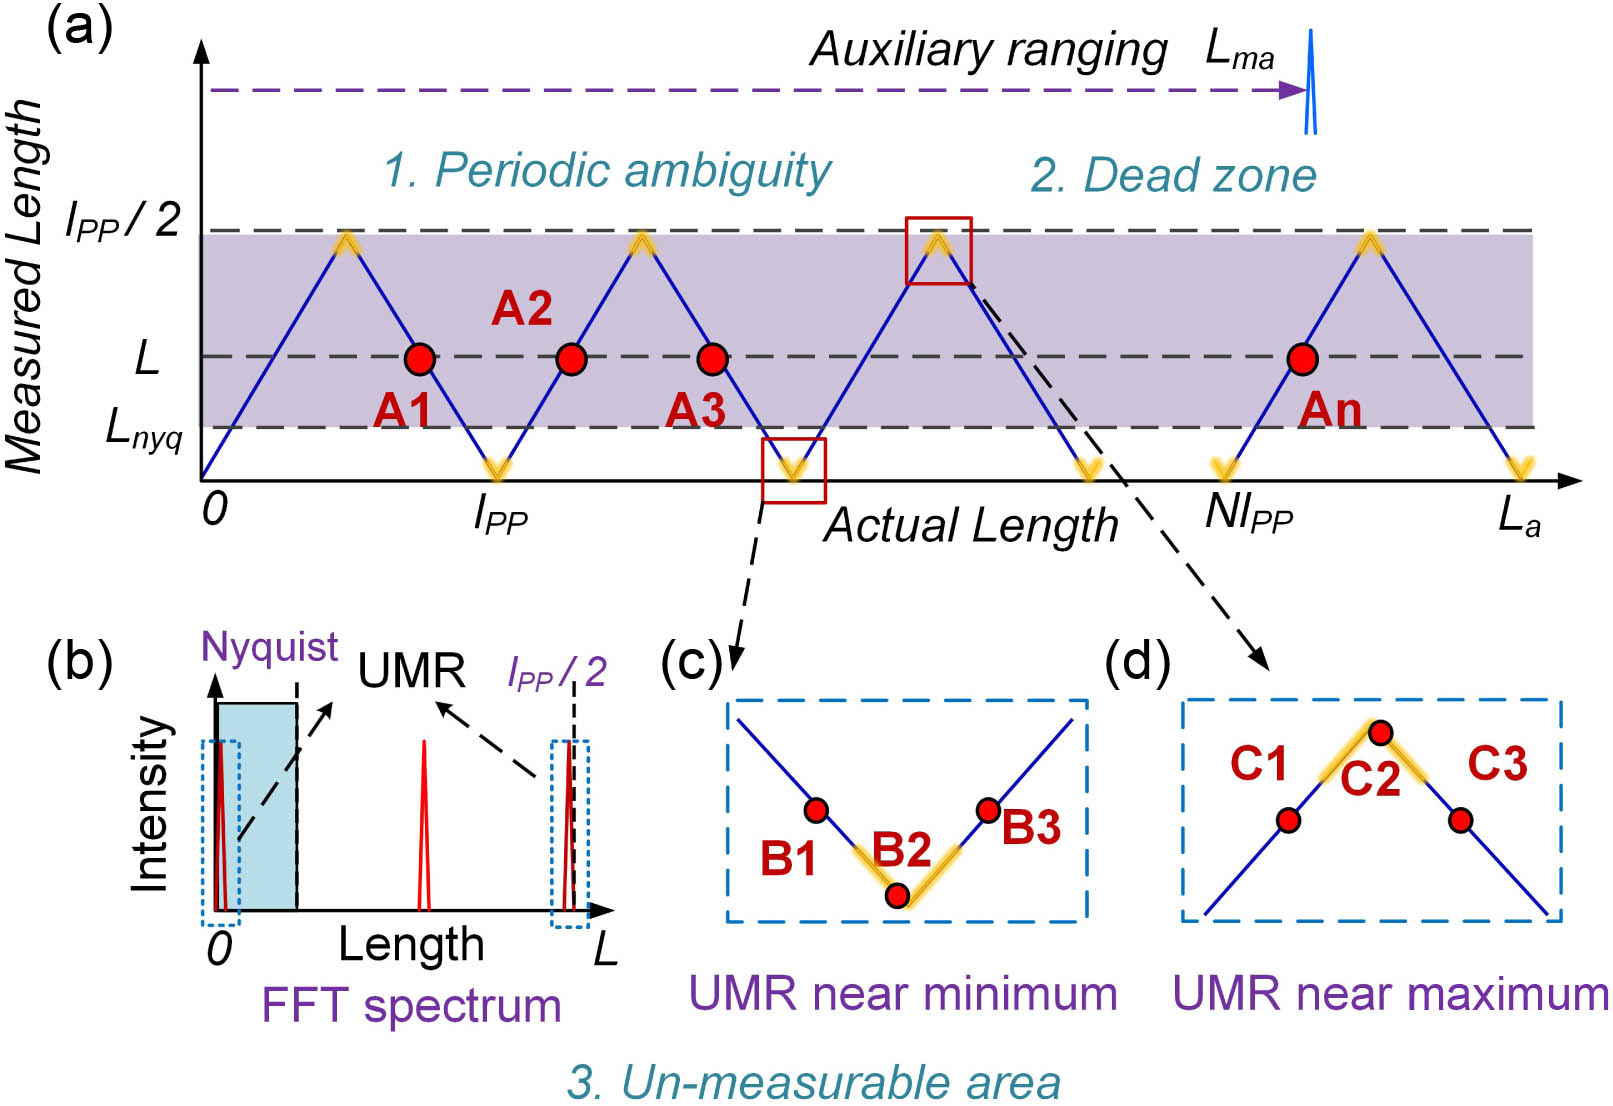
    Fig. 1. Existing issues associated with the conventional SPI length metrology. (a) The periodic ambiguities and the dead zones due to inadequate sampling rate and the data characteristics, which collectively result in the presence of prolonged un-measurable areas, marked with light purple. (b) The FFT spectra of interference data, where the Nyquist frequency limits the measurable region, marked in light blue. (c) and (d) Unmeasurable regions near the minimum and the maximum positions. An, Bn, and Cn are representative positions to be measured. UMR, unmeasurable region; FFT, fast Fourier transform.
    (a) Schematic overview of the proposed linear group delay spectral interferometry for full-range nanometric precision length metrology. (b) Several methods for introducing linear group delay, including metasurfaces, carefully designed arrays of gratings, photonic integrated circuits (PICs), and customized chirped fiber Bragg gratings (CFBGs). (c) Different modes of the OFC are introduced with a linear time delay centered around the center mode. (d) Comparison between the proposed LGD-SPI and typical SPI. Our proposed approach offers a more convenient means of referencing light and measuring light, which facilitates interference occurrence and eliminates measurement dead zones. Comb, optical frequency comb; EOM, electro-optic modulator; SPI, spectral interferometry; OC, optical coupler; Col, collimator; CW, continuous wave laser; REF, reference mirror; TARG, target mirror; OSA, optical spectrum analyzer; PTT, phase transition tracking; UMR, unmeasurable region; MR, measurable region.
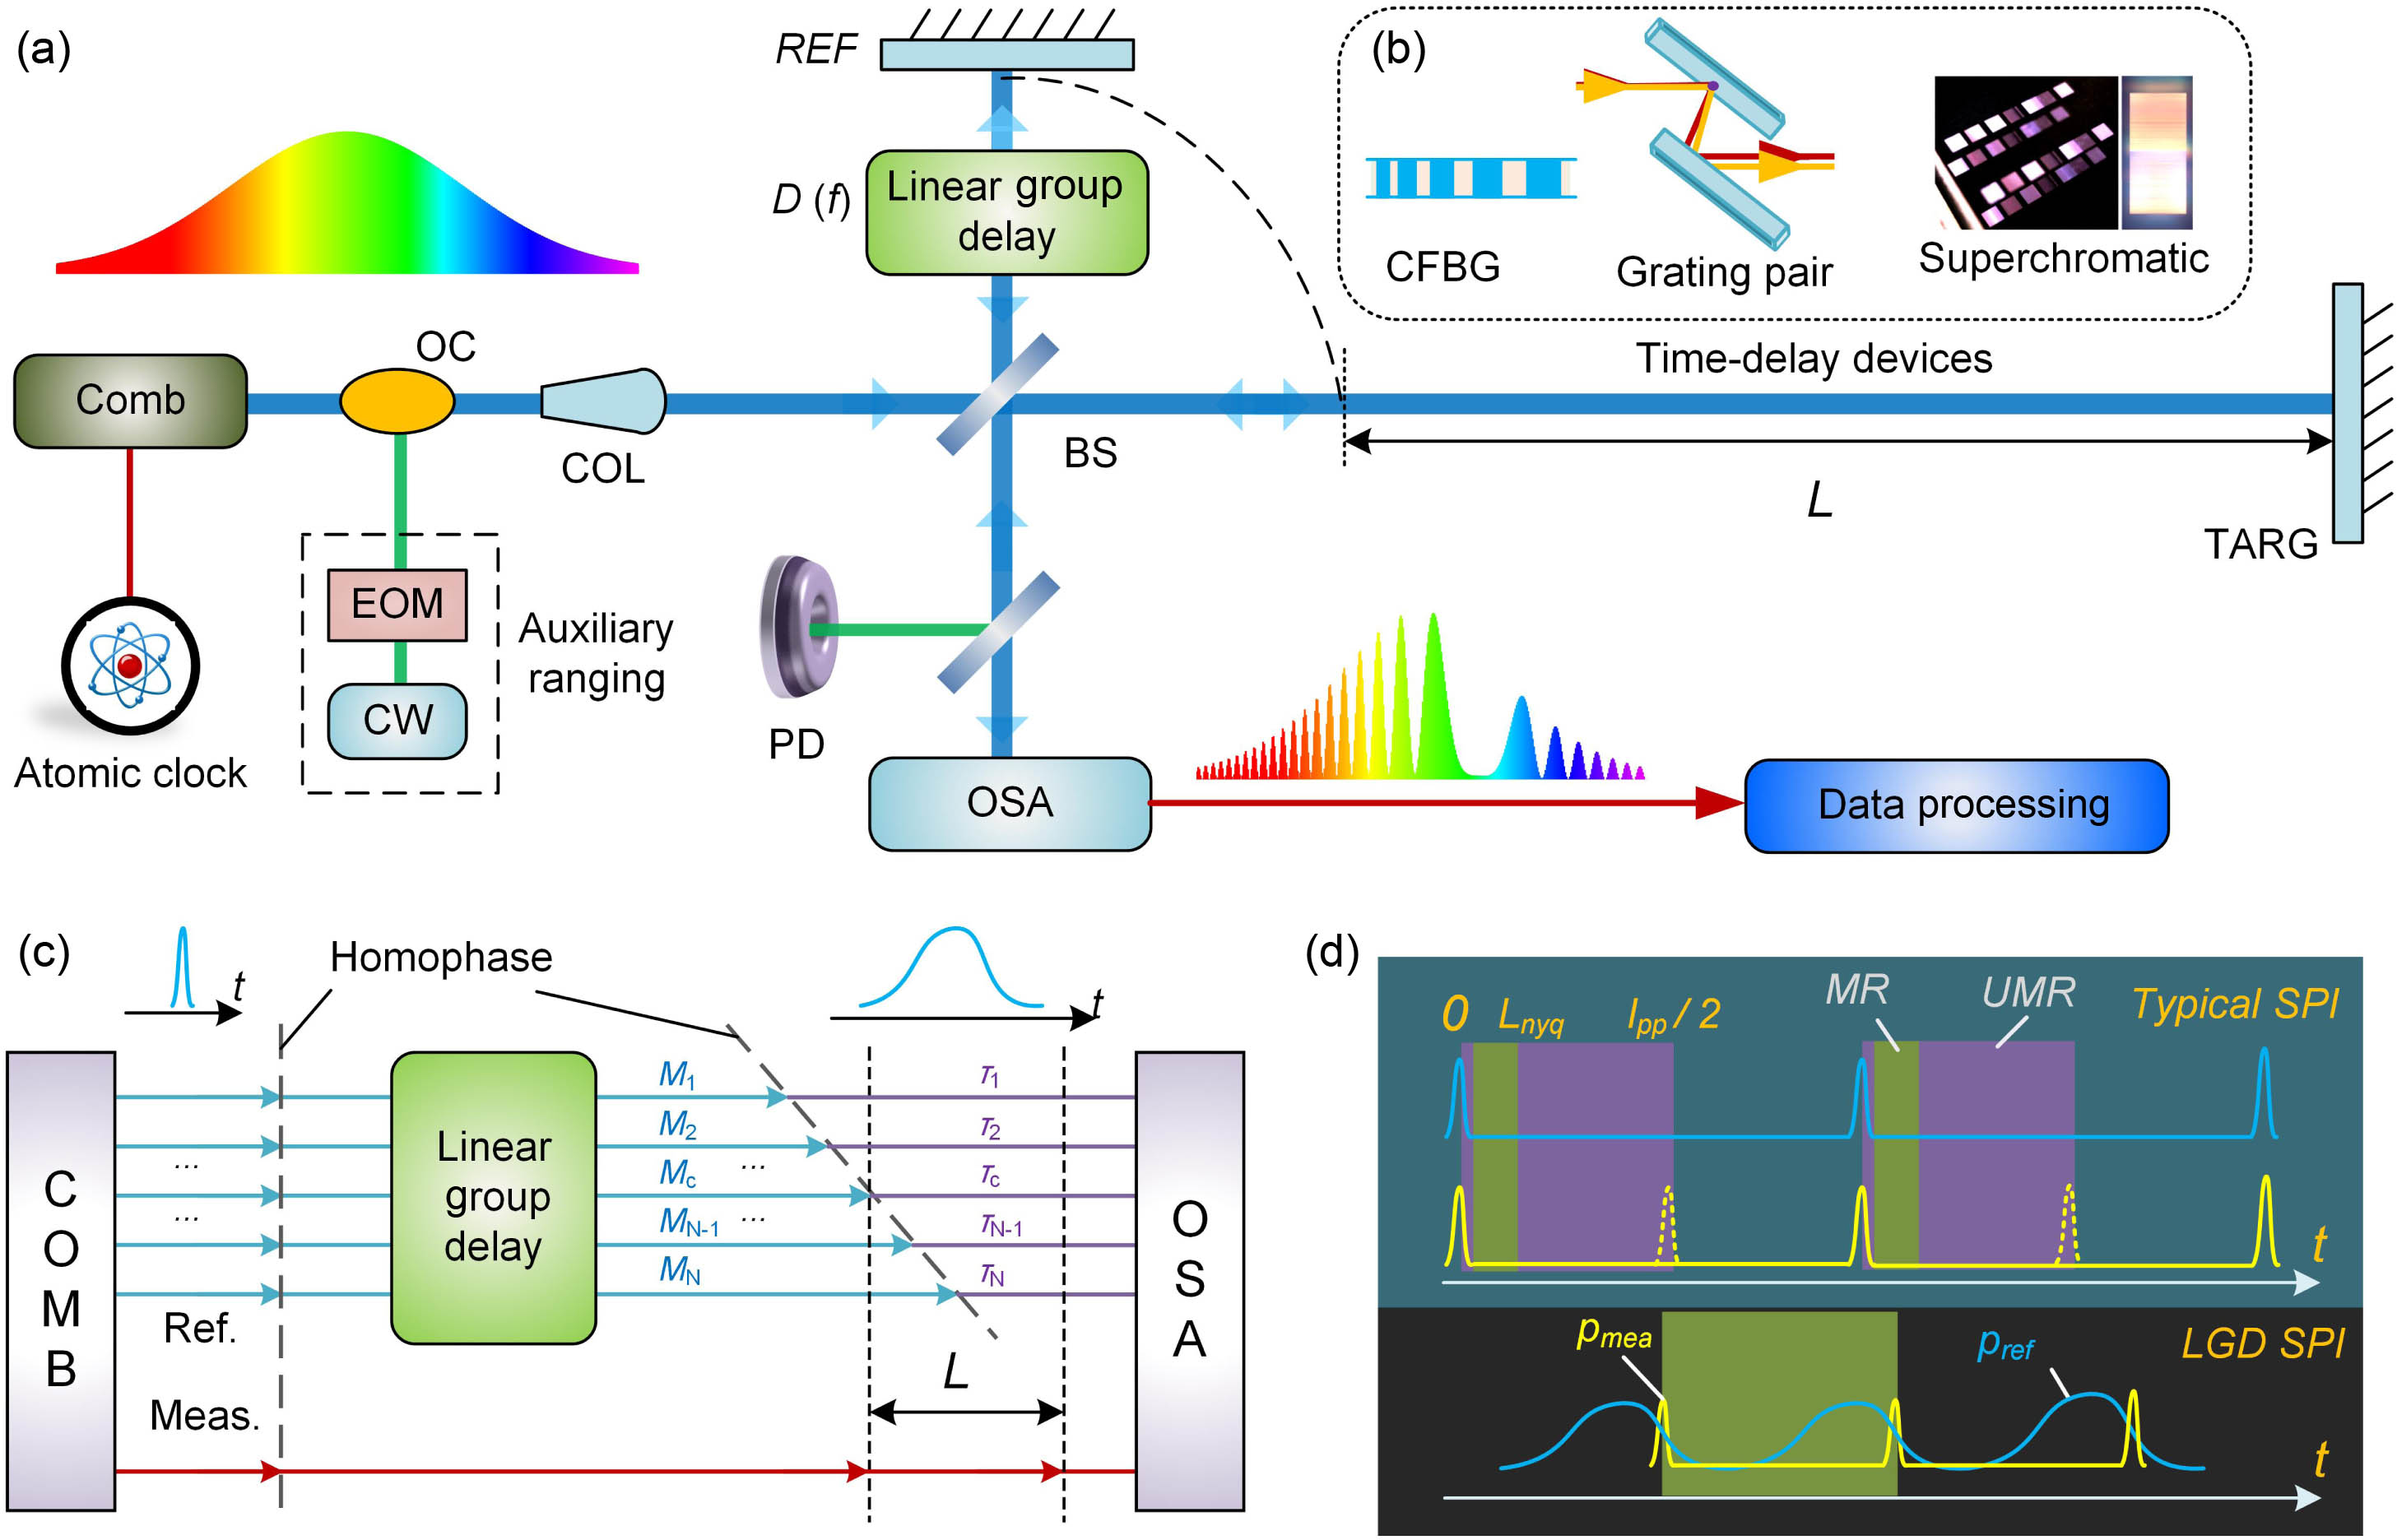
    Fig. 2. (a) Schematic overview of the proposed linear group delay spectral interferometry for full-range nanometric precision length metrology. (b) Several methods for introducing linear group delay, including metasurfaces, carefully designed arrays of gratings, photonic integrated circuits (PICs), and customized chirped fiber Bragg gratings (CFBGs). (c) Different modes of the OFC are introduced with a linear time delay centered around the center mode. (d) Comparison between the proposed LGD-SPI and typical SPI. Our proposed approach offers a more convenient means of referencing light and measuring light, which facilitates interference occurrence and eliminates measurement dead zones. Comb, optical frequency comb; EOM, electro-optic modulator; SPI, spectral interferometry; OC, optical coupler; Col, collimator; CW, continuous wave laser; REF, reference mirror; TARG, target mirror; OSA, optical spectrum analyzer; PTT, phase transition tracking; UMR, unmeasurable region; MR, measurable region.
    Principle of LGD-SPI. (a) Theoretical interference spectrum with the mode index of the OFC as the horizontal axis and CIR0 as the periodic variation. (b) Trend of the unwrapped interference phase change, with the purple dashed line representing the trend of conventional SPI, the blue line representing the trend after group delay, and the light blue line representing the trend of mode distance spacing. (c) Trend of the wrapped interference phase change. (d), (e), and (f) Interference spectra at positions #1, #2, and #3, respectively. (g), (h), and (i) Corresponding interference phases of (d), (e), and (f), respectively, with the insets representing the relative position of the pulses.
    Fig. 3. Principle of LGD-SPI. (a) Theoretical interference spectrum with the mode index of the OFC as the horizontal axis and CIR0 as the periodic variation. (b) Trend of the unwrapped interference phase change, with the purple dashed line representing the trend of conventional SPI, the blue line representing the trend after group delay, and the light blue line representing the trend of mode distance spacing. (c) Trend of the wrapped interference phase change. (d), (e), and (f) Interference spectra at positions #1, #2, and #3, respectively. (g), (h), and (i) Corresponding interference phases of (d), (e), and (f), respectively, with the insets representing the relative position of the pulses.
    Principle of unmeasurable area elimination, which shows the frequency characteristics of interference oscillations in extreme cases when the measurement and reference pulses are furthest apart. The purple region is the spectral range of OFC, and the light blue region is the measurable region of the spectrometer. The green, blue, and red lines are the curves of the spectral oscillation frequency changing with the light frequency under different delay dispersion.
    Fig. 4. Principle of unmeasurable area elimination, which shows the frequency characteristics of interference oscillations in extreme cases when the measurement and reference pulses are furthest apart. The purple region is the spectral range of OFC, and the light blue region is the measurable region of the spectrometer. The green, blue, and red lines are the curves of the spectral oscillation frequency changing with the light frequency under different delay dispersion.
    Experimental structure and results. (a) Experimental system structure. (b) Spectra of the OFC and the reference path (Ref.). The LGD-FBG has a bandwidth exceeding 7 THz, allowing for full utilization of the OFC’s spectral range. (c) Schematic diagram of an interference spectrum. (d) Phase characteristics of the interference spectrum and data processing method. The phase curve is a quadratic curve with inflection points, and the parameters of the curve are fitted to obtain the measured parameters. (e) A heat-map composed of continuous, equidistant interferometric spectra. (f) Measurement results of continuous displacement. The displacement stage is moved with equal intervals, and the interferometer results are used as reference to calculate the errors. The measurement range spans one NAR of traditional SPI system, demonstrating the system’s capability for dead-zone-free distance measurement. The insets A, B, and C show interference spectra at different positions. Col, collimator lens; TCM, tested corner mirror; CM, corner mirror; DCF, dispersion compensating fiber; PD, photodetector; CIR, circulator; LGD-FBG, linearly group-delayed fiber Bragg grating.
    Fig. 5. Experimental structure and results. (a) Experimental system structure. (b) Spectra of the OFC and the reference path (Ref.). The LGD-FBG has a bandwidth exceeding 7 THz, allowing for full utilization of the OFC’s spectral range. (c) Schematic diagram of an interference spectrum. (d) Phase characteristics of the interference spectrum and data processing method. The phase curve is a quadratic curve with inflection points, and the parameters of the curve are fitted to obtain the measured parameters. (e) A heat-map composed of continuous, equidistant interferometric spectra. (f) Measurement results of continuous displacement. The displacement stage is moved with equal intervals, and the interferometer results are used as reference to calculate the errors. The measurement range spans one NAR of traditional SPI system, demonstrating the system’s capability for dead-zone-free distance measurement. The insets A, B, and C show interference spectra at different positions. Col, collimator lens; TCM, tested corner mirror; CM, corner mirror; DCF, dispersion compensating fiber; PD, photodetector; CIR, circulator; LGD-FBG, linearly group-delayed fiber Bragg grating.
    (a) Results of 1000 repeated distance measurements at a single point 5 m away. (b) Allan deviation of the results plotted against the averaging time. (c) Histogram showing the distribution of the results. (d) Quantile-quantile plots of the measurement results, which closely resemble a straight line, indicating that the error is mainly influenced by random errors. MSD, mean square deviation.
    Fig. 6. (a) Results of 1000 repeated distance measurements at a single point 5 m away. (b) Allan deviation of the results plotted against the averaging time. (c) Histogram showing the distribution of the results. (d) Quantile-quantile plots of the measurement results, which closely resemble a straight line, indicating that the error is mainly influenced by random errors. MSD, mean square deviation.
    Jindong Wang, Jingsheng Huang, Qihua Liu, Wei Du, Fumin Zhang, Tao Zhu. Linear group delay spectral interferometry for full-range precision absolute length metrology[J]. Photonics Research, 2024, 12(2): 313
    Download Citation