• Photonics Research
  • Vol. 12, Issue 2, 313 (2024)
Jindong Wang1、2、3、†, Jingsheng Huang1、†, Qihua Liu2、†, Wei Du1, Fumin Zhang2, and Tao Zhu1、*
Author Affiliations
  • 1Key Laboratory of Optoelectronic Technology & Systems (Ministry of Education), Chongqing University, Chongqing 400044, China
  • 2State Key Laboratory of Precision Measuring Technology & Instruments, Tianjin University, Tianjin 300072, China
  • 3e-mail: jdwang@cqu.edu.cn
  • show less
    DOI: 10.1364/PRJ.506474 Cite this Article Set citation alerts
    Jindong Wang, Jingsheng Huang, Qihua Liu, Wei Du, Fumin Zhang, Tao Zhu. Linear group delay spectral interferometry for full-range precision absolute length metrology[J]. Photonics Research, 2024, 12(2): 313 Copy Citation Text show less

    Abstract

    The optical frequency comb serves as a powerful tool for distance measurement by integrating numerous stable optical modes into interferometric measurements, enabling unprecedented absolute measurement precision. Nonetheless, due to the periodicity of its pulse train, the comb suffers from measurement dead zones and ambiguities, thereby impeding its practical applications. Here, we present a linear group delay spectral interferometer for achieving precise full-range distance measurements. By employing a carefully designed linear group delay (LGD) device for phase modulation of the comb modes, interference can occur and be easily measured at any position. Our approach effectively eliminates the dead zones and ambiguities in comb-based ranging, without the need for cumbersome auxiliary scanning reference devices or reliance on complex high-repetition-rate combs or high-resolution spectrometers. We conducted length metrology experiments using a mode-locked comb referenced to a rubidium clock, achieving a large nonambiguity range up to 0.3 m, covering the entire measurement period. The maximum deviation compared to a laser interferometer was less than 1.5 μm, and the minimum Allan deviation during long-term measurements reached 5.47 nm at a 500 s averaging time. The approach ensures high accuracy while maintaining a simple structure, without relying on complex external devices, thereby propelling the practical implementation of comb-based length metrology.

    1. INTRODUCTION

    Length is recognized as one of the fundamental physical quantities in the International System of Units (SI) and has pervasive applications in diverse realms of human activities [1,2]. Length measurement plays an indispensable role in scientific investigations and industrial productions, as it enables the determination of geometric and spatial parameters that underpin the analysis and synthesis of complex systems [3]. In addition to its practical relevance, the concept of length has been extended to encompass a range of related quantities, including but not limited to the strain, vibration, dimension, and coordinate, which all involve the quantification of spatial characteristics [47]. Advancements in modern scientific techniques have brought about remarkable improvements in the precision and accuracy of length measurement, as the concept can now be traced back to fundamental physical constants, such as the speed of light and the wavelength of radiation [2]. The development of optical frequency combs (OFCs) has facilitated the link between natural standards and optical frequency standards, thus paving the way for unprecedented levels of precision in the realm of length measurement [815].

    In recent years, there has been a growing interest in the application of OFCs to interferometry, which enables the direct linkage between optical frequencies and readily controllable radio frequency signals, thereby allowing for sub-wavelength accuracy in absolute distance measurement, as opposed to the conventional approach of incremental measurement based on phase changes [16,17]. This development represents a revolutionary advancement with profound implications for precision metrology. Researchers have overcome many challenges and achieved long-range measurement with nanometer-level accuracy [1823]. Among various OFC-based ranging techniques, including dual comb ranging [21,2427], multi-wavelength interferometry [28,29], and synthetic-wavelength interferometry [30,31]; the spectral interferometry (SPI) method [18,3236], with relatively simple structure, utilizes simultaneously numerous longitudinal modes in laser interferometry and can be combined with homodyne interferometry (HDI) to achieve nanometric accuracy in length measurement [18,29]. Nevertheless, despite such advantages, the SPI method is suffering from significant and insurmountable challenges that there are many areas of the ranging range that cannot be measured, i.e., the unmeasurable regions (UMRs), preventing its genuine application in the field of ranging [3638]. In contrast, dual-comb ranging systems, which have complex structures, high costs, and require high-speed detectors, are gradually maturing and finding applications [25,32].

    In general, for a valid length-measuring instrument, its non-ambiguous range (NAR) should encompass the entire measurement period (half the pulse-to-pulse interval for OFC), meaning there are no UMRs. Figure 1 illustrates the fundamental reasons for the limitations of SPI ranging. The data processing of SPI directly relies on the fast Fourier transform (FFT) process, as shown in Fig. 1(b). The sampling rate of a spectrometer determines the Nyquist frequency, and once the frequency of spectral oscillations exceeds this value, the distance cannot be measured, leading to a lengthy dead zone in measurements, as shown in the grey areas in Fig. 1(a). Even with techniques of high-resolution spectrometer, such as the virtual phased array (VIPA) or high-repetition-rate OFCs like soliton microcombs (SMCs), which can eliminate most dead zones [22,29], the measurement near the extremum positions remains unattainable. The OFC is a periodic pulse, and due to the switching of the pulse, the measured distance values exhibit periodic variations with distance, as the positions A1, A2, A3, etc., shown in Fig. 1(a). The periodic ambiguity can be partly eliminated through auxiliary measurements, such as a low-precision phase-modulated rangefinder [18,39,40]. However, at the locations of periodic switching, i.e., near the extreme points of each period, symmetric ambiguities (B1 and B3) and aliasing (near B2) occur, as shown in Figs. 1(c) and 1(d). Besides, near the extremum positions, such as B2 and C2, the FFT spectrum peaks are too close to the zero position or the Nyquist limit, making it difficult to detect them and leading to unmeasurable regions again. Wu and Niu et al. have tried to solve the dead zone issue by chirped broadening pulse [41,42], but the optical delay lines are still involved, and the introduced dispersion will also introduce new uncertainty.

    Existing issues associated with the conventional SPI length metrology. (a) The periodic ambiguities and the dead zones due to inadequate sampling rate and the data characteristics, which collectively result in the presence of prolonged un-measurable areas, marked with light purple. (b) The FFT spectra of interference data, where the Nyquist frequency limits the measurable region, marked in light blue. (c) and (d) Unmeasurable regions near the minimum and the maximum positions. An, Bn, and Cn are representative positions to be measured. UMR, unmeasurable region; FFT, fast Fourier transform.

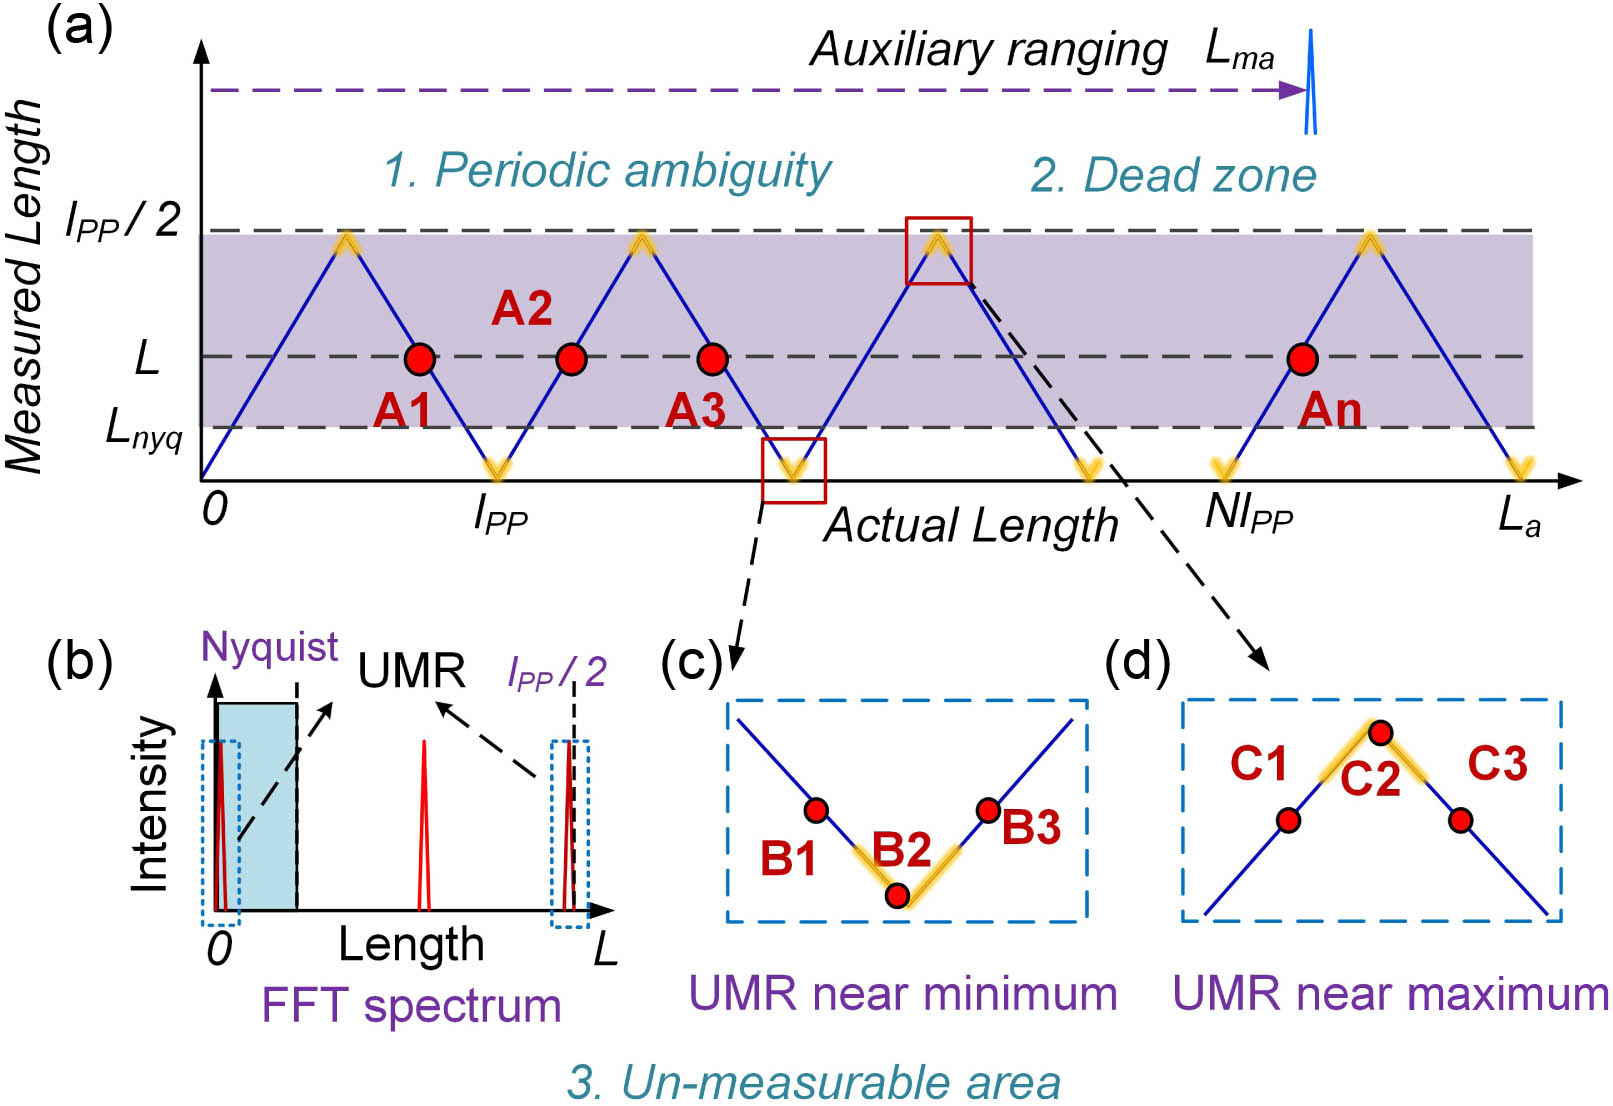
    Figure 1.Existing issues associated with the conventional SPI length metrology. (a) The periodic ambiguities and the dead zones due to inadequate sampling rate and the data characteristics, which collectively result in the presence of prolonged un-measurable areas, marked with light purple. (b) The FFT spectra of interference data, where the Nyquist frequency limits the measurable region, marked in light blue. (c) and (d) Unmeasurable regions near the minimum and the maximum positions. An, Bn, and Cn are representative positions to be measured. UMR, unmeasurable region; FFT, fast Fourier transform.

    Here, we present a novel, non-equilibrium Michelson interferometer based on an OFC for precision absolute length measurement at arbitrary positions without unmeasurable regions. We introduce precise control of a linear group delay in the reference arm, enabling low-frequency oscillation spectra, easily detected by the spectrometer, to deterministically appear within the OFC spectrum, which facilitates distance measurements with arbitrary positions and full range. In subsequent demodulation algorithms, we extensively utilize the numerous optical modes of the OFC to recover distance, resulting in higher accuracy and interference resistance. We experimentally demonstrate the precise measurement capability with a non-ambiguous range of covering the entire measurement period (0.3 m of a 250 MHz OFC), with residuals less than 1.5 μm compared to a He-Ne interferometer. This implies that, assisted by a simple low-precision ranging device, our system can achieve high-precision long-distance ranging with arbitrary distances. Additionally, the system exhibits superior long-term stability, achieving a minimum Allan deviation of 5.47 nm at a 500 s averaging time. And future integration with SMC will further leverage its unique advantages [43], suggesting enormous potential for practical applications.

    2. METHOD

    Figure 2 shows a schematic overview of our design. The framework of the absolute ranging system still relies on a Michelson interferometer, with the difference being the incorporation of dispersion control elements in the reference optical path, introducing linear group delay (LGD). A phase modulation ranging system consisting of an electro-optic modulator (EOM) and a continuous wave laser (CW) is placed in the same interferometric setup for auxiliary to achieve long distance measurements. For an OFC with a center frequency of fc and a repetition rate of frep, the frequency of each comb mode can be expressed as fi=fc+i×frep, where i represents the mode number. And the corresponding phase delay, also the oscillation frequency of the spectral interference pattern, is φ(fi)=2πfiτi, with τi the measurement-reference time-of-flight delay of mode i. In a medium where dispersion can be neglected, such as outer space or short-distance air propagation, the delay τi of each mode of OFC remains constant after traversing a distance of L: τi=naL/c, where na is the refractive index of medium, and c is the vacuum light speed. The interference phase under that condition is a linear first-order phase where the distance to be measured can be determined by calculating the slope of the phase or finding the peak of the Fourier transform spectrum [38]. However, as analyzed above, there exists a prolonged unmeasurable region.

    (a) Schematic overview of the proposed linear group delay spectral interferometry for full-range nanometric precision length metrology. (b) Several methods for introducing linear group delay, including metasurfaces, carefully designed arrays of gratings, photonic integrated circuits (PICs), and customized chirped fiber Bragg gratings (CFBGs). (c) Different modes of the OFC are introduced with a linear time delay centered around the center mode. (d) Comparison between the proposed LGD-SPI and typical SPI. Our proposed approach offers a more convenient means of referencing light and measuring light, which facilitates interference occurrence and eliminates measurement dead zones. Comb, optical frequency comb; EOM, electro-optic modulator; SPI, spectral interferometry; OC, optical coupler; Col, collimator; CW, continuous wave laser; REF, reference mirror; TARG, target mirror; OSA, optical spectrum analyzer; PTT, phase transition tracking; UMR, unmeasurable region; MR, measurable region.

    Figure 2.(a) Schematic overview of the proposed linear group delay spectral interferometry for full-range nanometric precision length metrology. (b) Several methods for introducing linear group delay, including metasurfaces, carefully designed arrays of gratings, photonic integrated circuits (PICs), and customized chirped fiber Bragg gratings (CFBGs). (c) Different modes of the OFC are introduced with a linear time delay centered around the center mode. (d) Comparison between the proposed LGD-SPI and typical SPI. Our proposed approach offers a more convenient means of referencing light and measuring light, which facilitates interference occurrence and eliminates measurement dead zones. Comb, optical frequency comb; EOM, electro-optic modulator; SPI, spectral interferometry; OC, optical coupler; Col, collimator; CW, continuous wave laser; REF, reference mirror; TARG, target mirror; OSA, optical spectrum analyzer; PTT, phase transition tracking; UMR, unmeasurable region; MR, measurable region.

    In our proposed scheme, after applying carefully designed dispersion elements to introduce linear group delay, the expression for the flight time delay should be revised as follows: τi=naL/c+GD(fi), where GD(fi) is the introduced linear group delay that can be expressed as GD(fi)=D1(fifc), with D1 being the group delay coefficient. The relationship between D1 and the group delay dispersion (GDD) is that GDD=D1/π. Figure 2(b) depicts several approaches for introducing linear group delay, such as metasurfaces, carefully designed arrays of gratings, photonic integrated circuits (PICs), and customized chirped fiber Bragg gratings (CFBGs). For instance, CFBGs are optical devices that have a spatially varying refractive index. By carefully designing the spatial distribution of modulation, CFBGs can introduce linear group delay across a specified spectral range. As illustrated in Fig. 2(c), different modes of the OFC are introduced with a linear time delay centered around fc. In this case, the interference pattern is no longer uniform, and its phase becomes quadratic: φ(fi)=2π[D1fi2+(naL/cD1fc)fi]. This implies that the interference pattern will contain richer frequency components, ranging from low to high frequencies, effectively addressing the issue of the difficulty of measuring a single frequency, such as the problem of high frequencies exceeding the sampling frequency, or low frequencies near the zero position, as shown in Fig. 2(d).

    In the LGD-SPI we designed, the characteristics of three interference signals can be revealed by Fig. 3. Due to the periodic nature (2π) of trigonometric functions, the interference pattern forms a periodic-like chirped curve [Fig. 3(a)], and its phase exhibits periodic variations as a quadratic curve [Fig. 3(b)]. The length of the period depends on the value of D1. The actual phase (wrapped phase) of the interference intensity corresponds to taking the original phase modulo 2π, as the wrapped interference phase depicted in Fig. 3(c). As the OFC has a limited spectral range, the spectrum measured by an optical spectrum analyzer (OSA) captures only a portion of the interference pattern and is influenced by the shape of the OFC spectrum. Figures 3(d), 3(e), and 3(f) depict the measured interference patterns in three typical scenarios, corresponding to the zero-crossing, the intermediate region, and the vicinity of the maximum-crossing, respectively. The phase curves associated with these patterns are illustrated in Figs. 3(g), 3(h), and 3(i), respectively, with the insets illustrating the relative positions of the measurement-reference pulses.

    Principle of LGD-SPI. (a) Theoretical interference spectrum with the mode index of the OFC as the horizontal axis and CIR0 as the periodic variation. (b) Trend of the unwrapped interference phase change, with the purple dashed line representing the trend of conventional SPI, the blue line representing the trend after group delay, and the light blue line representing the trend of mode distance spacing. (c) Trend of the wrapped interference phase change. (d), (e), and (f) Interference spectra at positions #1, #2, and #3, respectively. (g), (h), and (i) Corresponding interference phases of (d), (e), and (f), respectively, with the insets representing the relative position of the pulses.

    Figure 3.Principle of LGD-SPI. (a) Theoretical interference spectrum with the mode index of the OFC as the horizontal axis and CIR0 as the periodic variation. (b) Trend of the unwrapped interference phase change, with the purple dashed line representing the trend of conventional SPI, the blue line representing the trend after group delay, and the light blue line representing the trend of mode distance spacing. (c) Trend of the wrapped interference phase change. (d), (e), and (f) Interference spectra at positions #1, #2, and #3, respectively. (g), (h), and (i) Corresponding interference phases of (d), (e), and (f), respectively, with the insets representing the relative position of the pulses.

    As long as D1 is regarded as a constant, the phase curve can be represented as a standard quadratic curve, and its first derivative curve is a straight line. The intercept of this line contains information about the measured distance L. Taking into account the differential of the interference phase, when the differential is zero integer multiple of 2π, i.e., dφ=4πD1(f+naL/2cD1fc/2)frep=2kπ, with k a natural number, it corresponds to a zero-crossing point, i.e., the intercept of the straight line, also the phase transition points. Hence, the frequencies of fpt0 can be illustrated by fpt0=k/2frepD1naL/2cD1+fc/2.

    It can be observed according to Eq. (1) that the position of the phase transition points is directly linearly related to the measured distance L. When k is known, accurately determining the measured distance becomes possible by tracking the position of the phase transition points, L=[cD1(fc2fpt0)+kc/frep]/na.

    Directly searching for the zero-crossing position has a lower accuracy and is easily affected by intensity noise. Therefore, we perform linear fitting on the first derivative of the phase curve within the effective range and take the intercept of the fitted line as the measured value of fpt0. This allows us to fully utilize the multiple modes of OFC, thereby offering higher precision and noise resistance. The latter part of Eq. (2) corresponds to the integer component in long-distance measurements, known as the pulse count, which can be accurately determined through auxiliary measurements. In traditional SPI, the generation of the dead zone is attributed to the low sampling rate of the spectrometer, which prevents the measurement of high-frequency oscillations. By contrast, in our LGD-SPI technique, we can eliminate the unmeasurable regions throughout the entire measurement range by adjusting the magnitude of D1, which allows the low-frequency oscillations to deterministically appear within the range of the OFC spectrum, as shown in Fig. 3. The oscillation frequency of the interferometric spectrum varies linearly with the optical frequency, with a certain periodicity Cir0. According to Eq. (1), the circle of the phase transition points, that is to say the frequency interval of adjacent phase transition points, Cir0 is 1/2frepD1.

    The fundamental reason for the existence of the measurement dead zone is the excessively long distance between the measuring pulse and the reference pulse. This leads to a high oscillation frequency of the interference, making it impossible for the spectrometer to measure accurately. Our approach involves transforming the oscillation frequency from a singular frequency to a linearly changing one. Hence, as long as this periodicity is appropriate, the low-frequency portion of the oscillation will inevitably appear within the spectral range. And, near the phase transition frequency, there are low-frequency oscillations that are easily captured by the spectrometer, which can effectively eliminate the unmeasurable area. An intuitive representation is depicted in Fig. 4, which shows the frequency characteristics of interference oscillations in extreme cases when the measurement and reference pulses are furthest apart. This position is the most difficult for measuring the signal; if this position can be measured, the full range of measurement can be achieved. Once Cir0 is smaller than the OFC spectral range BOFC (as the red line shows in Fig. 4), i.e., 1/2frepD1<BOFC, D1>1/2frepBOFC, the phase transition points will inevitably occur within the measured spectrum, and even a spectrometer with low resolution can conduct distance measurements across the entire range. Furthermore, the resolution of the spectrometer introduces the Nyquist frequency, which can reduce the demand for D1 (as the blue line shows in Fig. 4). The higher the resolution of the spectrometer, the greater the measurement accuracy, and the smaller the requirement for D1. In the case of OFC, a larger repetition rate results in a reduced demand for chromatic dispersion. However, it is crucial to avoid employing D1 that is too large. A smaller dispersion allows for the measurement of longer spectral ranges, enabling the capture of more detailed information. Therefore, a balanced compromise among these factors is necessary.

    Principle of unmeasurable area elimination, which shows the frequency characteristics of interference oscillations in extreme cases when the measurement and reference pulses are furthest apart. The purple region is the spectral range of OFC, and the light blue region is the measurable region of the spectrometer. The green, blue, and red lines are the curves of the spectral oscillation frequency changing with the light frequency under different delay dispersion.

    Figure 4.Principle of unmeasurable area elimination, which shows the frequency characteristics of interference oscillations in extreme cases when the measurement and reference pulses are furthest apart. The purple region is the spectral range of OFC, and the light blue region is the measurable region of the spectrometer. The green, blue, and red lines are the curves of the spectral oscillation frequency changing with the light frequency under different delay dispersion.

    Also, the directionality of the group delay completely eliminates the ambiguity of symmetry. As a result, precise absolute distance measurements can be achieved at any position, effectively overcoming the limitations of unmeasurable areas.

    3. RESULTS

    To verify the proposed approach, an experimental system shown in Fig. 5(a) is built. We employ a mode-locked laser OFC with a repetition rate of approximately 250 MHz (adjustable within a small range), which is well locked to a rubidium clock (SRS FS725) in terms of both repetition rate and offset frequency. The OFC has a pulse-to-pulse length of 1.2 m, corresponding to a measurement cycle of 0.3 m of SPI (lpp/4 with lpp the pulse to pulse interval). The OFC is split into two paths: one serves as the measurement light and is directed through a collimator lens (Col) towards the tested corner mirror (TCM), while the other path acts as the reference. The reference path consists of a carefully designed linearly group-delayed fiber Bragg grating (LGD-FBG) for providing linear group delay. D1 is designed as 2×10²²  s2. The LGD-FBG has a reflecting bandwidth exceeding 7 THz (about 50 nm), as shown in Fig. 5(b), allowing for full utilization of the OFC’s spectral range. To improve the linearity of the group delay, a small segment of dispersion compensating fiber (DCF) is added for correction. The accurate group delay parameters can be precisely recalibrated in the experiments. The TCM is mounted on a precision electronically controlled rail, and another He–Ne laser interferometer (Renishaw XL-80) with 0.5×10⁶L accuracy is coaxially aligned with it to eliminate Abbe error. The laser interferometer provides a high-precision reference displacement to evaluate the system performance. A photodetector (PD) and a spectrum analyzer are used together to precisely measure the repetition frequency of the OFC. The combined beams from the reference and measurement paths are transmitted through a circulator (CIR) to an optical spectrum analyzer (OSA, AQ6370C-20, with a maximum resolution of 0.01 nm, i.e., 1.25 GHz) for measuring the interferometric spectra. A spectrum schematic obtained by the OSA is shown in Fig. 5(c). The experiment was conducted in a highly clean environment, with temperature and humidity maintained at a constant level, effectively shielding against noise. Real-time environmental parameters are also utilized for the calculation and calibration of air refractive index.

    Experimental structure and results. (a) Experimental system structure. (b) Spectra of the OFC and the reference path (Ref.). The LGD-FBG has a bandwidth exceeding 7 THz, allowing for full utilization of the OFC’s spectral range. (c) Schematic diagram of an interference spectrum. (d) Phase characteristics of the interference spectrum and data processing method. The phase curve is a quadratic curve with inflection points, and the parameters of the curve are fitted to obtain the measured parameters. (e) A heat-map composed of continuous, equidistant interferometric spectra. (f) Measurement results of continuous displacement. The displacement stage is moved with equal intervals, and the interferometer results are used as reference to calculate the errors. The measurement range spans one NAR of traditional SPI system, demonstrating the system’s capability for dead-zone-free distance measurement. The insets A, B, and C show interference spectra at different positions. Col, collimator lens; TCM, tested corner mirror; CM, corner mirror; DCF, dispersion compensating fiber; PD, photodetector; CIR, circulator; LGD-FBG, linearly group-delayed fiber Bragg grating.

    Figure 5.Experimental structure and results. (a) Experimental system structure. (b) Spectra of the OFC and the reference path (Ref.). The LGD-FBG has a bandwidth exceeding 7 THz, allowing for full utilization of the OFC’s spectral range. (c) Schematic diagram of an interference spectrum. (d) Phase characteristics of the interference spectrum and data processing method. The phase curve is a quadratic curve with inflection points, and the parameters of the curve are fitted to obtain the measured parameters. (e) A heat-map composed of continuous, equidistant interferometric spectra. (f) Measurement results of continuous displacement. The displacement stage is moved with equal intervals, and the interferometer results are used as reference to calculate the errors. The measurement range spans one NAR of traditional SPI system, demonstrating the system’s capability for dead-zone-free distance measurement. The insets A, B, and C show interference spectra at different positions. Col, collimator lens; TCM, tested corner mirror; CM, corner mirror; DCF, dispersion compensating fiber; PD, photodetector; CIR, circulator; LGD-FBG, linearly group-delayed fiber Bragg grating.

    First, we move the motorized rail with a fixed step size and simultaneously measure the distance traveled using our system and the He–Ne interferometer. The difference in the results is used as errors to evaluate the performance of our system. The spectral data processing method is shown in Fig. 5(d). First, we employ steps comprising the Fourier transform, inverse Fourier transform, and envelope filtering to obtain the interferometric phase curve. Then, we calculate the first derivative of the phase curve and perform linear fitting on it. This allows us to obtain the slope for correcting the group delay parameters and calculate the intercept of the line to determine the measured distance according to Figure 5(e), which illustrates a heatmap composed of continuous, equidistant interferometric spectra. The wave-like information in the heatmap indicates the positional variation of the oscillation zero-crossings (highlighted by red arrows), revealing a linear trend with respect to distance. Since we employ a fitting method to obtain the intercept, we can make full use of every mode of the optical frequency comb (OFC) and achieve accurate distance measurements even in cases where zero crossings are not present, as seen in scenarios #2 and #3 in Fig. 3(d).

    Our system can achieve precise distance measurements at any position without the need for devices to adjust the reference optical path, scanning light sources, or using ultra-high-resolution OSAs, such as the VIPA technology. Figure 5(f) demonstrates the continuous ranging capability of our system across one measurement cycle, with a distance span of 0.5 m, which implies that our ranging system’s NAR covers the entire measurement cycle, 0.3 m, enabling full-range length measurement. Besides, compared to the interferometer, the maximum measurement error is less than 1.5 μm. Due to the large span, both the rail and environmental fluctuations can decrease the accuracy of the interferometer. Therefore, we believe that the ranging performance of our system can achieve a similar level of precision to the interferometer.

    Furthermore, to demonstrate the ranging performance of our system, we conducted a long-term ranging experiment. At a distance of approximately 5 m, we continuously measured 1000 sets of data at intervals of 2 s. The ranging results are shown in Fig. 6(a), with a root mean square deviation (MSD) of 63.09 nm for the 1000 data sets. Figure 6(b) illustrates the Allan deviation of the measurement results, showing a minimum Allan deviation of 5.47 nm at 500 s averaging time. We also plotted the distribution histogram and the quantile-quantile plot of the results, shown in Figs. 6(c) and 6(d), which indicate that the data follow a normal distribution, primarily influenced by random errors.

    (a) Results of 1000 repeated distance measurements at a single point 5 m away. (b) Allan deviation of the results plotted against the averaging time. (c) Histogram showing the distribution of the results. (d) Quantile-quantile plots of the measurement results, which closely resemble a straight line, indicating that the error is mainly influenced by random errors. MSD, mean square deviation.

    Figure 6.(a) Results of 1000 repeated distance measurements at a single point 5 m away. (b) Allan deviation of the results plotted against the averaging time. (c) Histogram showing the distribution of the results. (d) Quantile-quantile plots of the measurement results, which closely resemble a straight line, indicating that the error is mainly influenced by random errors. MSD, mean square deviation.

    4. CONCLUSION

    In general, we present a novel approach that enables full-range precision ranging without the need for any adjustable components. Our solution does not require high-repetition-rate OFCs, such as soliton microcombs, nor does it rely on complex high-resolution spectrometers. Therefore, it possesses stronger potential for applications and paves the way for the maturation and implementation of OFC-based SPI ranging systems. Our approach is equally applicable to distance measurement using soliton microcombs for eliminating measurement ambiguities at pulse switching or overlapping points, and it can be combined with mode-resolved homodyne interferometry to achieve higher measurement accuracy. Additionally, employing better linear group delay devices can enhance the system’s performance. All of these aspects merit further investigation.

    Acknowledgment

    Acknowledgment. We thank the National Natural Science Foundation of China for helping identify collaborators for this work.

    References

    [1] N. V. Studentsov, P. N. Selivanov. The international system of units as a regular development of the metric-system of measurement. Meas. Techn., 26, 176-181(1983).

    [2] S. A. Diddams, J. C. Bergquist, S. R. Jefferts. Standards of time and frequency at the outset of the 21st century. Science, 306, 1318-1324(2004).

    [3] F.-L. Hong. Optical frequency standards for time and length applications. Meas. Sci. Technol., 28, 012002(2017).

    [4] A. Lewis. Measurement of length, surface form and thermal-expansion coefficient of length bars up to 1.5 m using multiple-wavelength phase-stepping interferometry. Meas. Sci. Technol., 5, 694-703(1994).

    [5] W. Fu, F. Yan, K. Chen. Scene distance measurement method based on light field imaging. Appl. Opt., 54, 6237-6243(2015).

    [6] C. J. Walsh. Measurements of absolute distances to 25 m by multiwavelength CO2-laser interferometry. Appl. Opt., 26, 1680-1687(1987).

    [7] H. J. Yang, J. Deibel, S. Nyberg. High-precision absolute distance and vibration measurement with frequency scanned interferometry. Appl. Opt., 44, 3937-3944(2005).

    [8] P. Balling, P. Kren, P. Masika. Femtosecond frequency comb based distance measurement in air. Opt. Express, 17, 9300-9313(2009).

    [9] K. Hei, K. Anandarajah, E. P. Martin. Absolute distance measurement with a gain-switched dual optical frequency comb. Opt. Express, 29, 8108-8116(2021).

    [10] A. Lesundak, D. Voigt, O. Cip. High-accuracy long distance measurements with a mode-filtered frequency comb. Opt. Express, 25, 32570-32580(2017).

    [11] N. Schuhler, Y. Salvade, S. Leveque. Frequency-comb-referenced two-wavelength source for absolute distance measurement. Opt. Lett., 31, 3101-3103(2006).

    [12] S. A. van den Berg, S. van Eldik, N. Bhattacharya. Mode-resolved frequency comb interferometry for high-accuracy long distance measurement. Sci. Rep., 5, 14661(2015).

    [13] B. Xue, Z. Wang, H. Zhang. Absolute distance measurement by self-heterodyne EO comb interferometry. IEEE Photon. Technol. Lett., 30, 861-864(2018).

    [14] W. Yu, P. Pfeiffer, A. Morsali. Comb-calibrated frequency sweeping interferometry for absolute distance and vibration measurement. Opt. Lett., 44, 5069-5072(2019).

    [15] H. Zhang, H. Wei, X. Wu. Absolute distance measurement by dual-comb nonlinear asynchronous optical sampling. Opt. Express, 22, 6597-6604(2014).

    [16] S. T. Cundiff, J. Ye. Colloquium: femtosecond optical frequency combs. Rev. Mod. Phys., 75, 325-342(2003).

    [17] T. Udem, R. Holzwarth, T. Haensch. Femtosecond optical frequency combs. Eur. Phys. J. Spec. Top., 172, 69-79(2009).

    [18] Y.-S. Jang, H. Liu, J. Yang. Nanometric precision distance metrology via hybrid spectrally resolved and homodyne interferometry in a single soliton frequency microcomb. Phys. Rev. Lett., 126, 023903(2021).

    [19] Y.-S. Jang, J. Park, J. Jin. Comb-mode resolved spectral domain interferometer enabled by a broadband electro-optic frequency comb. Photon. Res., 11, 72-80(2023).

    [20] J. Riemensberger, A. Lukashchuk, M. Karpov. Massively parallel coherent laser ranging using a soliton microcomb. Nature, 581, 164-170(2020).

    [21] M.-G. Suh, K. J. Vahala. Soliton microcomb range measurement. Science, 359, 884-887(2018).

    [22] J. Wang, Z. Lu, W. Wang. Long-distance ranging with high precision using a soliton microcomb. Photon. Res., 8, 1964-1972(2020).

    [23] G. Wu, S. Zhou, Y. Yang. Dual-comb ranging and its applications. Chin. J. Lasers, 48, 1504002(2021).

    [24] G. Wu, Q. Zhou, L. Shen. Experimental optimization of the repetition rate difference in dual-comb ranging system. Appl. Phys. Express, 7, 106602(2014).

    [25] Z. Zhu, G. Wu. Dual-comb ranging. Engineering, 4, 772-778(2018).

    [26] I. Coddington, W. C. Swann, L. Nenadovic. Rapid and precise absolute distance measurements at long range. Nat. Photonics, 3, 351-356(2009).

    [27] J. Zheng, Y. Wang, X. Wang. Optical ranging system based on multiple pulse train interference using soliton microcomb. Appl. Phys. Lett., 118, 261106(2021).

    [28] K. Falaggis, D. P. Towers, C. E. Towers. Multiwavelength interferometry: extended range metrology. Opt. Lett., 34, 950-952(2009).

    [29] S. A. van den Berg, S. T. Persijn, G. J. P. Kok. Many-wavelength interferometry with thousands of lasers for absolute distance measurement. Phys. Rev. Lett., 108, 183901(2012).

    [30] G. Wu, M. Takahashi, H. Inaba. Pulse-to-pulse alignment technique based on synthetic-wavelength interferometry of optical frequency combs for distance measurement. Opt. Lett., 38, 2140-2143(2013).

    [31] J. Xiong, L. Zhong, S. Liu. Improved phase retrieval method of dual-wavelength interferometry based on a shorter synthetic-wavelength. Opt. Express, 25, 7181-7191(2017).

    [32] S. Bak, G. H. Kim, H. Jang. Optical Vernier sampling using a dual-comb-swept laser to solve distance aliasing. Photon. Res., 9, 657-667(2021).

    [33] M. Cui, M. G. Zeitouny, N. Bhattacharya. Long distance measurement with femtosecond pulses using a dispersive interferometer. Opt. Express, 19, 6557-6570(2011).

    [34] G. Tang, X. Qu, F. Zhang. Absolute distance measurement based on spectral interferometry using femtosecond optical frequency comb. Opt. Laser Eng., 120, 71-78(2019).

    [35] K. E. Webb, J. K. Jang, J. Anthony. Measurement of microresonator frequency comb coherence by spectral interferometry. Opt. Lett., 41, 277-280(2016).

    [36] J. D. Wang, Z. Lu, W. Wang. Long-distance ranging with high precision using a soliton microcomb. Photon. Res., 8, 1964-1972(2020).

    [37] J. Wang, X. Qu, F. Zhang. Review of dispersive interferometry ranging with optical frequency comb and the instrumentation prospect. Proc. SPIE, 11437, 114370A(2020).

    [38] J.-W. Chen, J.-D. Wang, X.-H. Qu. Analysis of main parameters of spectral interferometry ranging using optical frequency comb and an improved data processing method. Acta Phys. Sin., 68, 190602(2019).

    [39] M. Godbout, J.-D. Deschenes, J. Genest. Spectrally resolved laser ranging with frequency combs. Opt. Express, 18, 15981-15989(2010).

    [40] K.-N. Joo, Y. Kim, S.-W. Kim. Distance measurements by combined method based on a femtosecond pulse laser. Opt. Express, 16, 19799-19806(2008).

    [41] H. Wu, F. Zhang, T. Liu. Absolute distance measurement by chirped pulse interferometry using a femtosecond pulse laser. Opt. Express, 23, 31582-31593(2015).

    [42] Q. Niu, J. Zheng, X. Cheng. Arbitrary distance measurement without dead zone by chirped pulse spectrally interferometry using a femtosecond optical frequency comb. Opt. Express, 30, 35029-35040(2022).

    [43] H. Shu, L. Chang, Y. Tao. Microcomb-driven silicon photonic systems. Nature, 605, 457-463(2022).

    Jindong Wang, Jingsheng Huang, Qihua Liu, Wei Du, Fumin Zhang, Tao Zhu. Linear group delay spectral interferometry for full-range precision absolute length metrology[J]. Photonics Research, 2024, 12(2): 313
    Download Citation