


 0.0001


 0.0001


 0.0006
 0.0002


 0.0003


 0.0003


 0.0005


 0.0006


 0.0003


Bo Han, Feilu Wang, Jiayong Zhong, Guiyun Liang, Huigang Wei, Dawei Yuan, Baojun Zhu, Fang Li, Chang Liu, Yanfei Li, Jiarui Zhao, Zhe Zhang, Chen Wang, Jun Xiong, Guo Jia, Neng Hua, Jianqiang Zhu, Yutong Li, Gang Zhao, Jie Zhang. Measurement and analysis of K-shell lines of silicon ions in laser plasmas[J]. High Power Laser Science and Engineering, 2018, 6(2): 02000e31
- High Power Laser Science and Engineering
- Vol. 6, Issue 2, 02000e31 (2018)
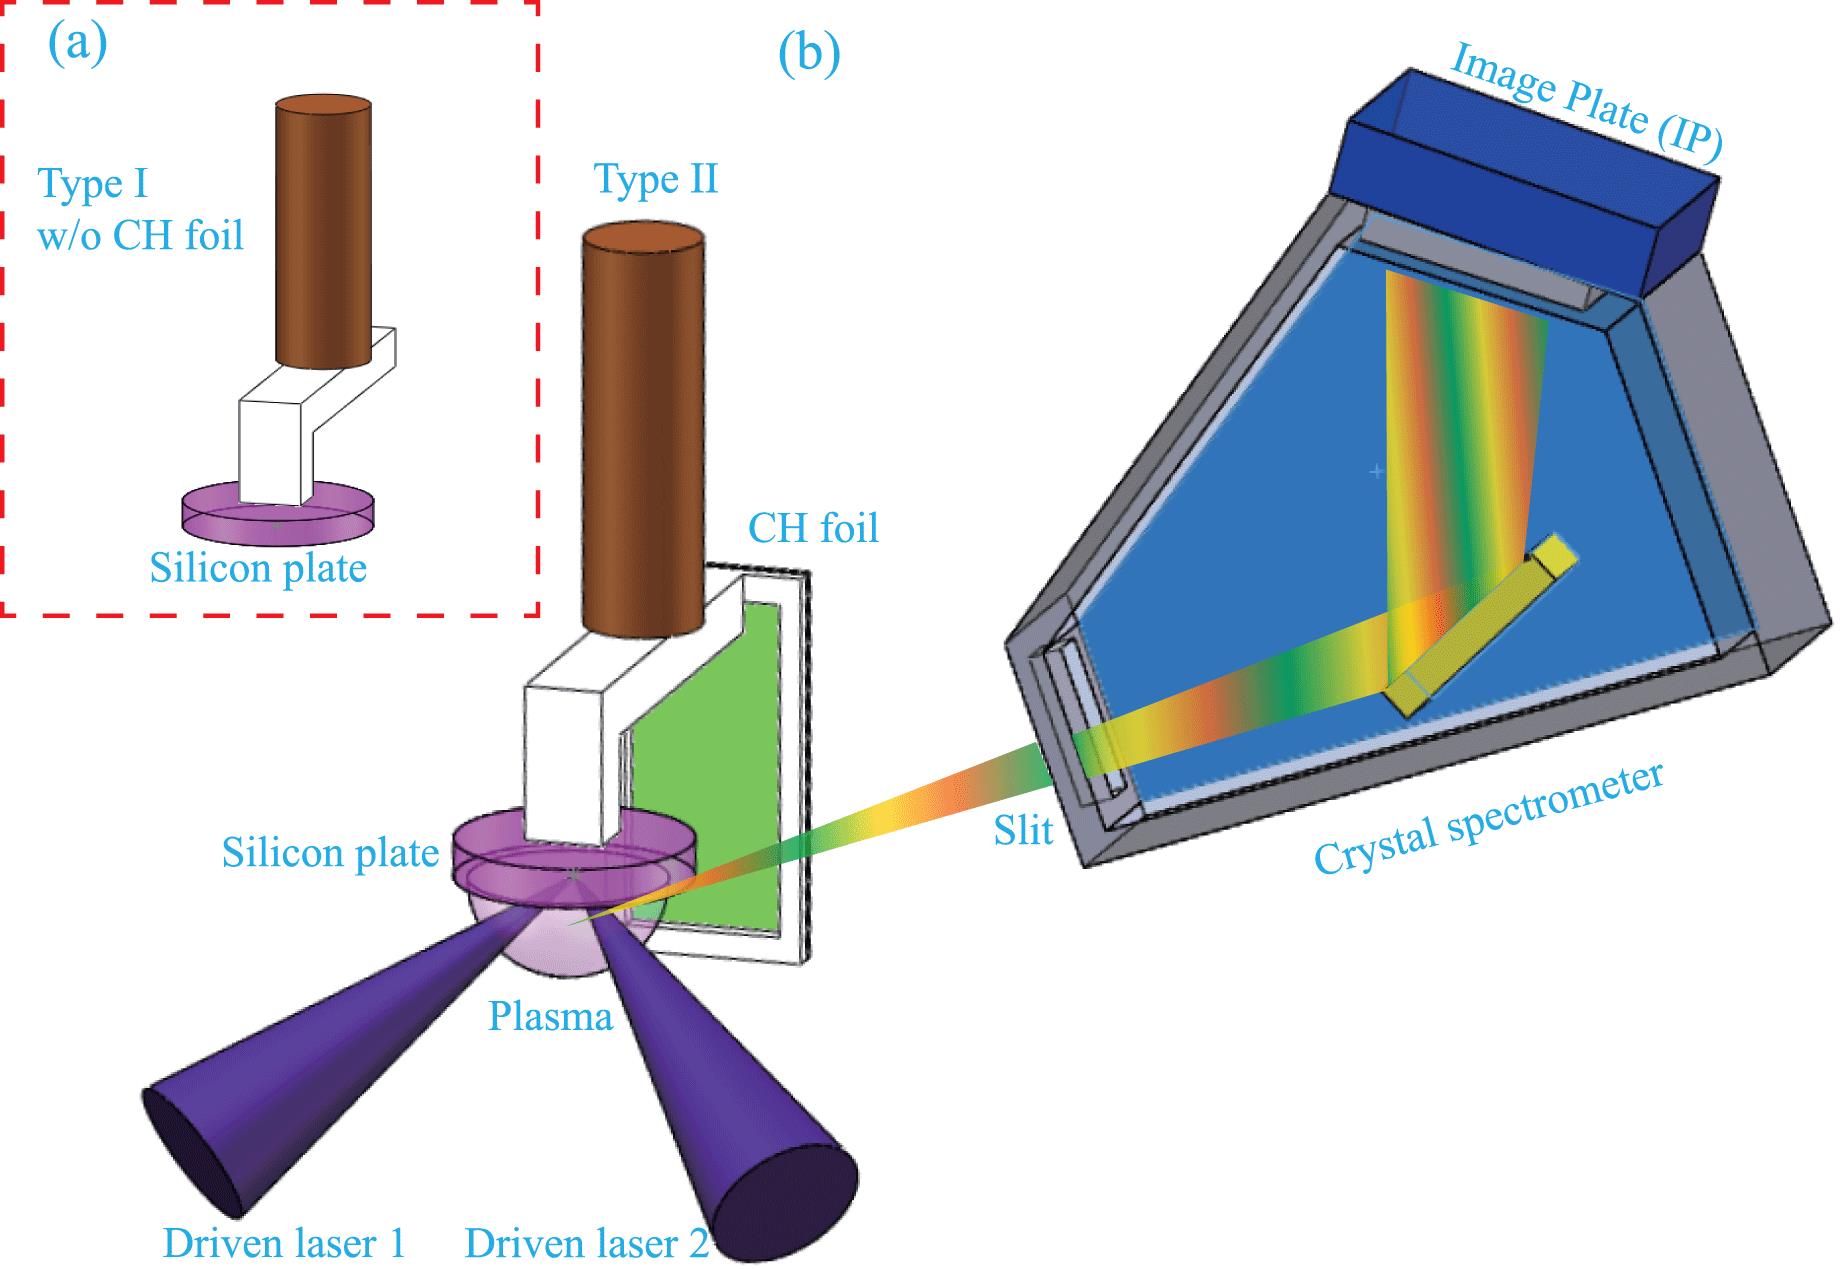
Fig. 1. Two types of targets and schematic diagram of the experimental setups. (a) The Type I target. (b) The Type II shot and the schematic diagram of the experimental setups. The silicon plate is set at the target chamber center (TCC), and two driven laser beams are focused on it. A crystal spectrometer is used to record the spectrum of plasma.
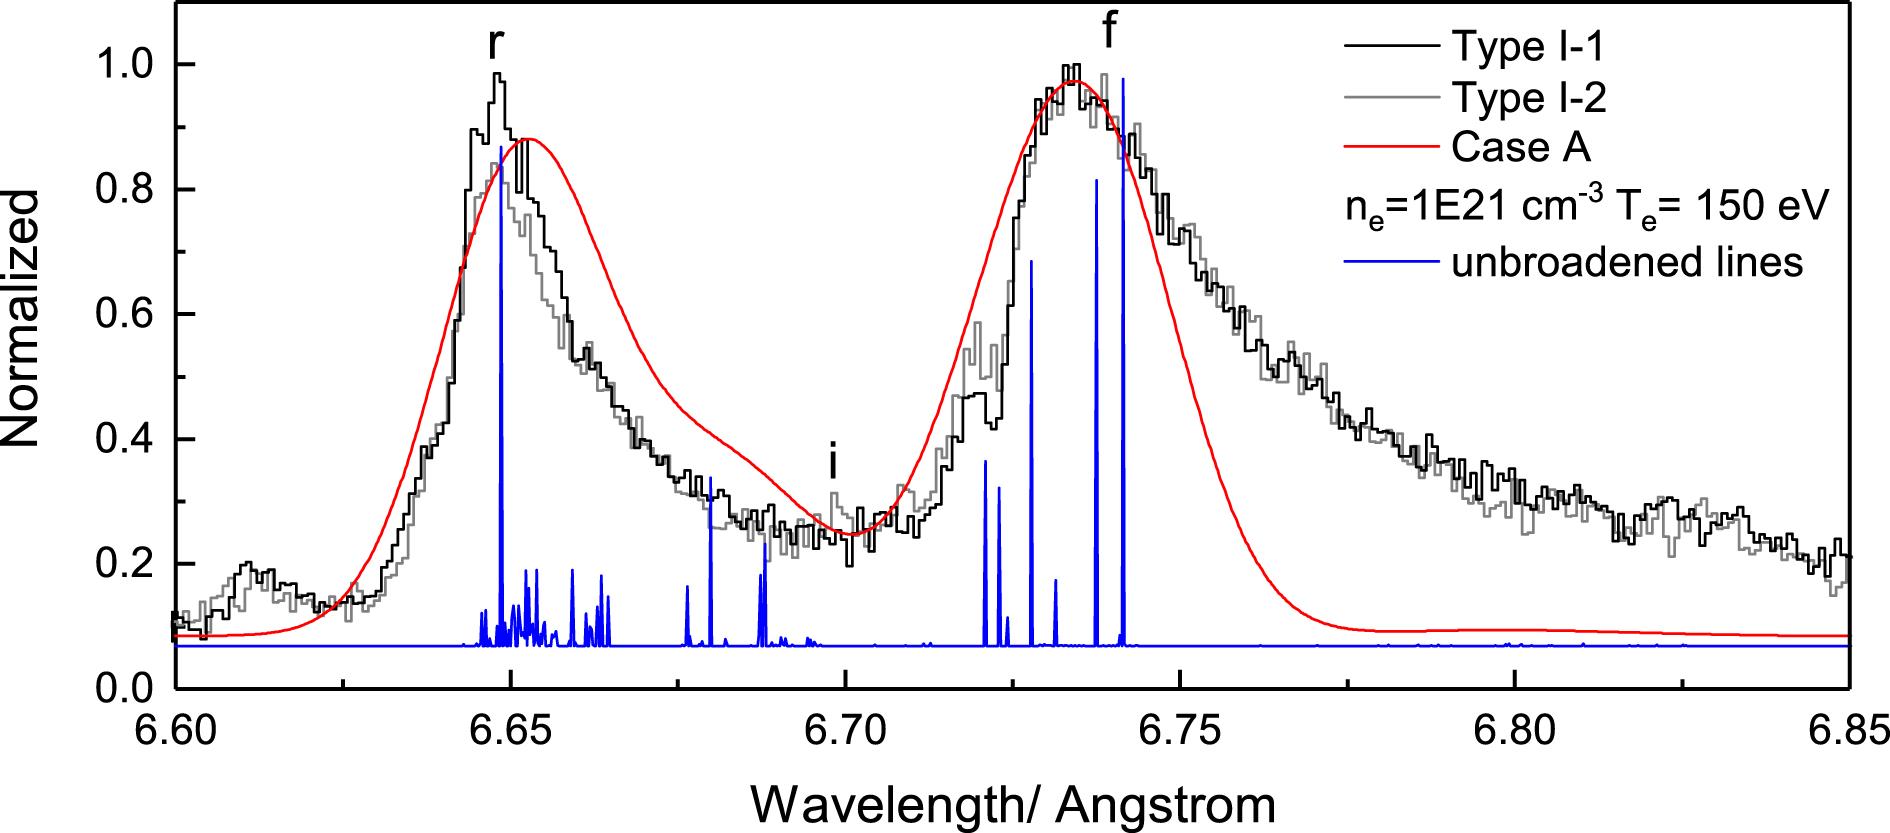
Fig. 2. Black and gray lines are the experimental spectra of two Type I shots. Red line is the simulation results (Case A), where  and
and  . Blue line is the unbroadened theoretical line.
and . Blue line is the unbroadened theoretical line. Fig. 3. Black and gray lines are the experimental spectra of two Type II shots. Red line is the simulation results (Case B), where  and
and  .
.
and . Fig. 4. Black line is the experimental spectrum of repeated Type II targets in 2017. Red line is the simulation results (Case C), where  and
and  .
.
and . Fig. 5. (a) and (b) are the interferograms of Type I and Type II shots. (c) and (d) are the electron density distribution deduced by Abel inversing of (a) and (b).
Fig. 6. The  and
and  values. Every line has same electron density, which spans from
  to
to  exponentially, and the line ratios are plotted as a function of electron temperature.
and values. Every line has same electron density, which spans from to exponentially, and the line ratios are plotted as a function of electron temperature. Fig. 7. The  (red) and
  (black) values. Every line has same electron temperature, which spans from 100 eV to 500 eV incrementally, and the line ratios are plotted as a function of electron density.
(red) and (black) values. Every line has same electron temperature, which spans from 100 eV to 500 eV incrementally, and the line ratios are plotted as a function of electron density. Fig. 8. The solid scatters are the experimental  and
and  values. The open scatters are the
  and
and  values of the three theoretical cases.
and values. The open scatters are the and values of the three theoretical cases.
| ||||||||||||||||||||||||||||||||||||||||||||||||||||||||||||||||||||||||||||||||||||||||||||||||||||||||||||||||||||||||||||||||||||||||||||||||||||||||||||||||||||||||||||||||||||||||||||||||||||||||||||||||||||||||||||||||||||||||||||||||||||||||||||||||||||||||||||||||||||||||||||||||||||||||||||||||||||||||||||||||||||||||||||||||||||||||||||||||||||||||||||||||||||||||||
Table 1. Experimental peak centroids with statistical errors of Shot 26, and the present and theoretical wavelength of intense lines in Case A.
| ||||||||||||||||||||||||||||||||||||||||||||||||||||||||||||||||||||||||||||||||||||||||||||||||||||||||||||||||||||||||||||||||||||||||||||||||||||||||||||||||||||||||||||||||||||||||||||||||||||||||||||||||||||||||||||||||||||||||||||||||||||||||||||||||||||||||||||||||||||||
Table 2. Experimental peak centroids with statistical errors from 6.6 Å to 6.85 Å of Shot 32 and the present and theoretical wavelength of intense lines in Case B.

Set citation alerts for the article
Please enter your email address
© Copyright 2018-2021 | Chinese Laser Press. All Rights Reserved 沪ICP备15018463号-20