
Bo Han, Feilu Wang, Jiayong Zhong, Guiyun Liang, Huigang Wei, Dawei Yuan, Baojun Zhu, Fang Li, Chang Liu, Yanfei Li, Jiarui Zhao, Zhe Zhang, Chen Wang, Jun Xiong, Guo Jia, Neng Hua, Jianqiang Zhu, Yutong Li, Gang Zhao, Jie Zhang. Measurement and analysis of K-shell lines of silicon ions in laser plasmas[J]. High Power Laser Science and Engineering, 2018, 6(2): 02000e31
- High Power Laser Science and Engineering
- Vol. 6, Issue 2, 02000e31 (2018)
Abstract
1 Introduction
K-shell lines of elements from astrophysical X-ray sources have been widely identified in high-resolution spectra, which are observed by X-ray satellites, such as Chandra and XMM-Newton. There are not only strong emission lines from photoionized plasmas of X-ray binaries[
Many theoretical calculations[ transition lines in Si XI to Si XIV ions in beam-foil experiment. Ref. [
 elements in laser plasmas produced by a CO
 -laser. Ref. [
 transitions of silicon ions using EBIT-I electron beam ion trap at the Lawrence Livermore National Laboratory.
Few of the former works interpreted the line emission mechanism in detail. More importantly, we find that satellite lines may be blended with the He-like triplet lines, and impact their line ratios, which are widely used in plasma diagnosis. Here, we report the spectroscopic experiment of silicon on Shenguang II laser facility and the recalculated line ratios of He-like triplet. Section
Sign up for High Power Laser Science and Engineering TOC. Get the latest issue of High Power Laser Science and Engineering delivered right to you!Sign up now
2 Experimental setups and spectra
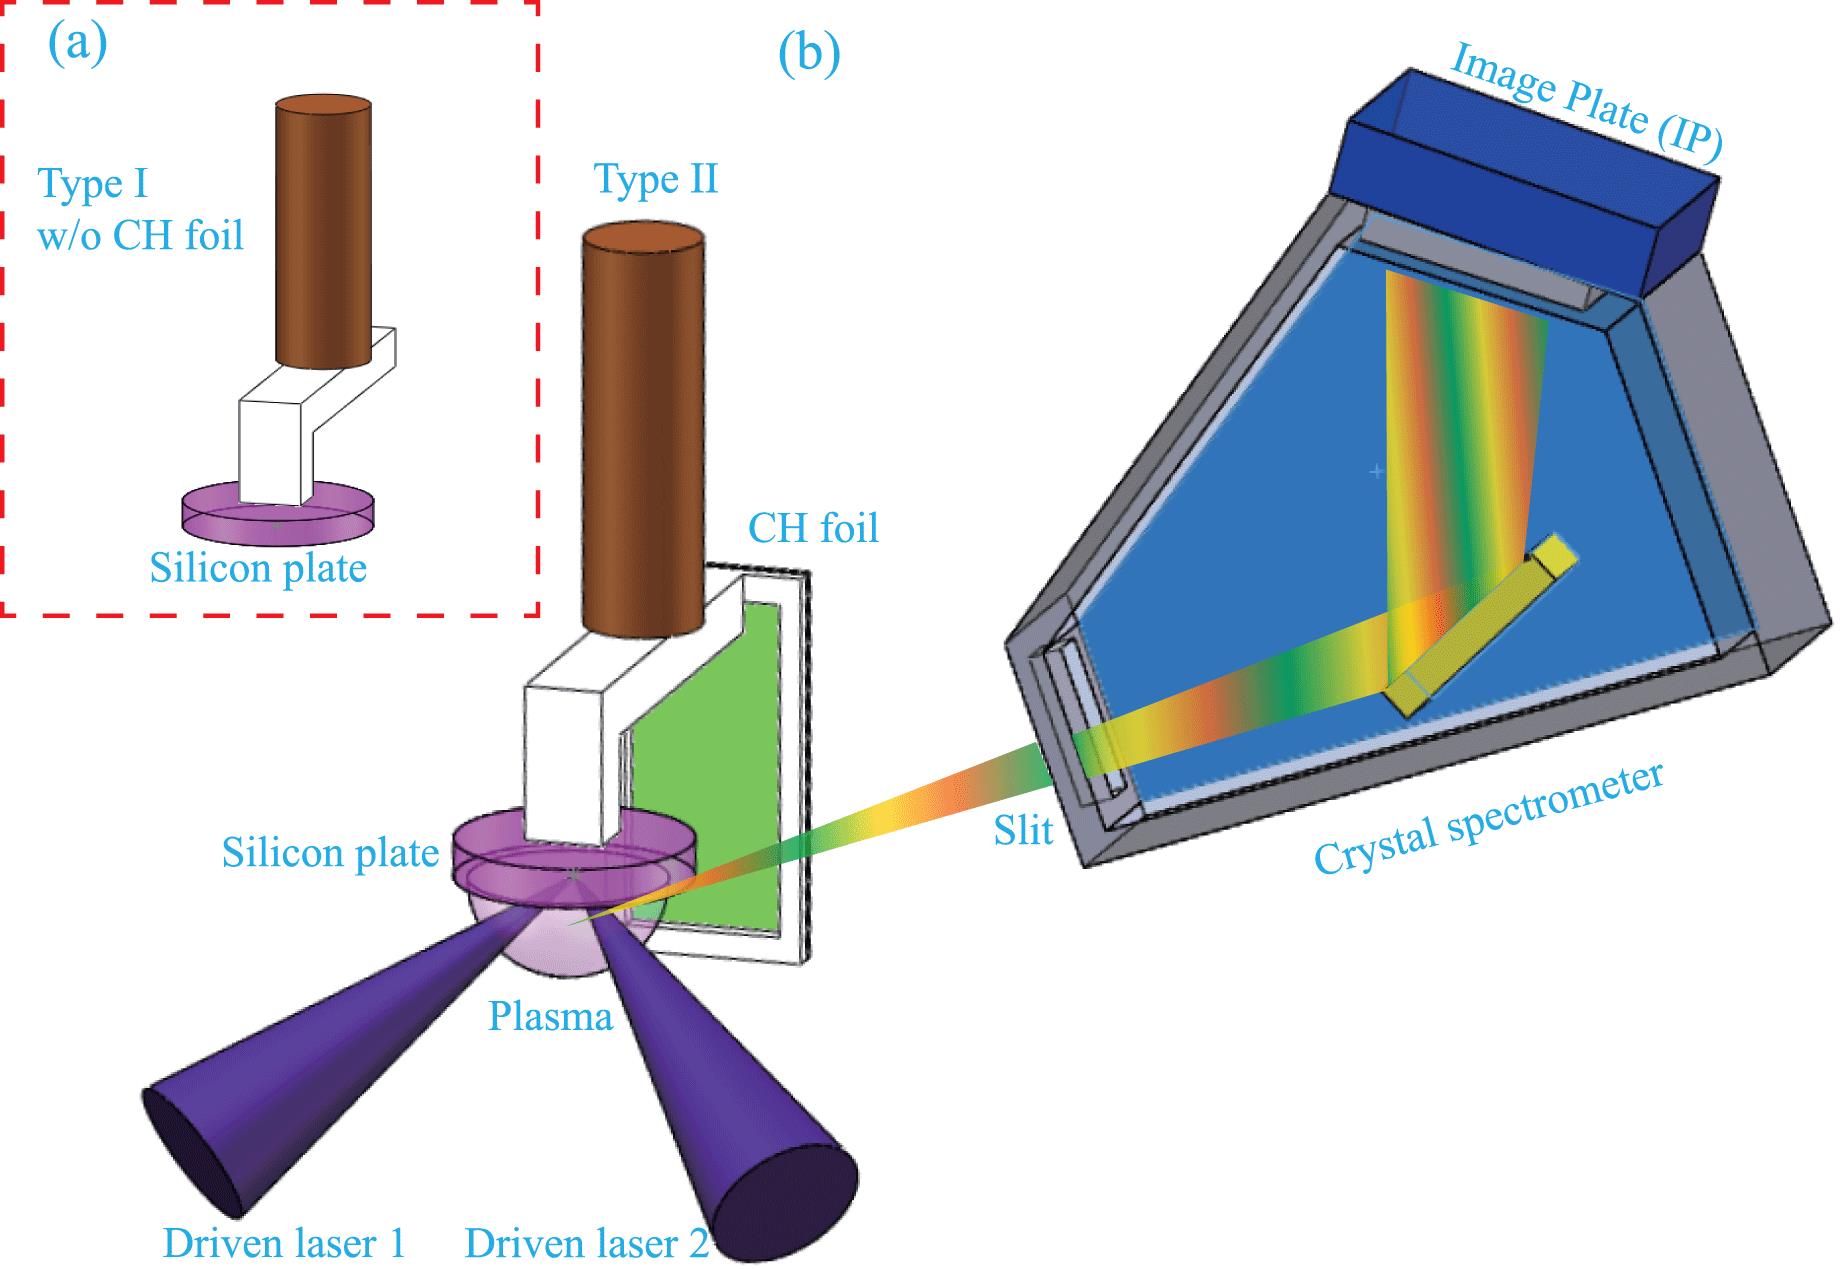
The experiments were carried out on the Shenguang II laser facility at Shanghai Institute of Optics and Fine Mechanics, Chinese Academy of Sciences. Two types of targets were performed to get the spectra of highly charged silicon ions. Figure  in diameter. Shot 24 and Shot 26 used the Type I target. Figure
  full-width at half-maximum (FWHM), and the incident laser intensity is about
  [
[
Figures  .
.
3 Theoretical simulations
We use the radiative-collisional code (RCF) based on flexible atomic code (FAC)[
The atomic data include ions from C-like to bare nuclei. The maximum of principle quantum number,  , is limited to 4 for C-like, B-like and Be-like ions.
  s of Li-like, He-like and H-like ions are 7. In the simulations, the plasmas are assumed to be in collisional radiative steady state. Collisional processes include collisional excitation, collisional ionization, autoionization and their inverse processes, which are collisional deexcitation, three-body recombination and dielectron capture. Radiative processes include radiative recombination and E1, E2, M1 and M2 types of radiative decays. The spectra we are interested in, are from the He-like and Li-like ions, which only exist in highly ionized plasma. Although the spectra might be influenced by lines from lower ionized ions, the comparison between the experimental and theoretical spectra shows that the influence is small, such as the tail of the second peaks in Figure
| Ion | Transition | Case | ||||||
|---|---|---|---|---|---|---|---|---|
| (Å) | (Å) | (Å) | Upper | Lower | ||||
| Li | 6.6457 |  |  |  |  | A | ||
| Li | 6.6462 |  |  |  |  | A | ||
| Li | 6.6479 |  |  |  |  | A | ||
| He | 6.6486 | 6.648 |  |  |  |  | A | |
| Li | 6.6491 |  |  |  |  | A | ||
| Li | 6.6491 |  |  |  |  | A | ||
| Li | 6.6503 |  |  |  |  | A | ||
| Li | 6.6504 |  |  |  |  | A | ||
| Li | 6.6506 |  |  |  |  | A | ||
| Li | 6.6523 |  |  |  |  | A | ||
| Li | 6.6527 |  |  |  |  | A | ||
| Li | 6.6527 |  |  |  |  | A | ||
| Li | 6.6539 |  |  |  |  | A | ||
| Li | 6.6544 |  |  |  |  | A | ||
| Li | 6.6549 |  |  |  |  | A | ||
| Li | 6.6551 |  |  |  |  | A | ||
| Li | 6.6552 |  |  |  |  | A | ||
| Li | 6.6562 |  |  |  |  | A | ||
6.6565 0.0001 0.0001 | Li | 6.6565 |  |  |  |  | A | |
| Li | 6.6568 |  |  |  |  | A | ||
| Li | 6.6592 |  |  |  |  | A | ||
| Li | 6.6593 |  |  |  |  | A | ||
| Li | 6.6612 |  |  |  |  | A | ||
| Li | 6.6618 |  |  |  |  | A | ||
| Li | 6.6622 |  |  |  |  | A | ||
| Li | 6.663 |  |  |  |  | A | ||
| Li | 6.6635 |  |  |  |  | A | ||
| Li | 6.6635 |  |  |  |  | A | ||
| Li | 6.6646 |  |  |  |  | A | ||
| Li | 6.6764 |  |  |  |  | A | ||
| Li | 6.6799 | 6.6776 |  |  |  |  | A | |
| Li | 6.6872 | 6.6854 |  |  |  |  | A | |
| Li | 6.6878 | 6.6866 |  |  |  |  | A | |
| Li | 6.7207 | 6.7176 |  |  |  |  | A | |
| Li | 6.7228 | 6.7196 |  |  |  |  | A | |
| Li | 6.7242 |  |  |  |  | A | ||
| Li | 6.7277 |  |  |  |  | A | ||
| Li | 6.7278 | 6.7293 |  |  |  |  | A | |
6.7333 0.0001 0.0001 | Li | 6.7374 | 6.7365 |  |  |  |  | A |
| Li | 6.7415 | 6.7398 |  |  |  |  | A | |
Table 1. Experimental peak centroids with statistical errors of Shot 26, and the present and theoretical wavelength of intense lines in Case A.
Figures  and the electron temperature is 150 eV, well reproduces the two stocky peaks in the Type I spectra. The tail of the second peak in long wavelength range may attribute to the lines of Be-like and B-like ions, which are emitted in low temperature condition. In Case B, most of the peaks in Type II spectrum are reproduced, and the input parameters are
  and
and  . The unproduced peaks may be Cu L-shell lines, which are emitted by the copper frame of the CH foil[
| Ion | Transition | Case | ||||||
|---|---|---|---|---|---|---|---|---|
| (Å) | (Å) | (Å) | Upper | Lower | ||||
6.627 0.0006 0.0006 | ||||||||
6.648  0.0002 0.0002 | He | 6.6486 | 6.648 |  |  |  |  | B |
| Li | 6.6523 |  |  |  |  | B | ||
| Li | 6.6539 |  |  |  |  | B | ||
| Li | 6.6592 |  |  |  |  | B | ||
| Li | 6.6593 |  |  |  |  | B | ||
| Li | 6.6612 |  |  |  |  | B | ||
| Li | 6.6618 |  |  |  |  | B | ||
| Li | 6.663 |  |  |  |  | B | ||
| Li | 6.6635 |  |  |  |  | B | ||
| Li | 6.6635 |  |  |  |  | B | ||
| Li | 6.6646 |  |  |  |  | B | ||
6.6829 0.0003 0.0003 | Li | 6.6799 | 6.6776 |  |  |  |  | B |
| Li | 6.6872 | 6.6854 |  |  |  |  | B | |
| Li | 6.6878 | 6.6866 |  |  |  |  | B | |
6.688  0.0003 0.0003 | He | 6.6911 | 6.6899 |  |  |  |  | B |
| Li | 6.7207 | 6.7176 |  |  |  |  | B | |
6.7136 0.0005 0.0005 | Li | 6.7228 | 6.7196 |  |  |  |  | B |
| Li | 6.7278 | 6.7293 |  |  |  |  | B | |
6.7372 0.0006 0.0006 | Li | 6.7374 | 6.7365 |  |  |  |  | B |
| Li | 6.7415 | 6.7398 |  |  |  |  | B | |
| Be | 6.7971 | 6.7992 |  |  |  |  | B | |
6.7952 0.0003 0.0003 | Be | 6.7987 | 6.7995 |  |  |  |  | B |
| Be | 6.7989 | 6.8008 |  |  |  |  | B | |
| Be | 6.7991 | 6.7999 |  |  |  |  | B | |
| Be | 6.7995 | 6.8016 |  |  |  |  | B | |
| Be | 6.8211 | 6.8046 |  |  |  |  | B | |
| Be | 6.8251 | 6.8239 |  |  |  |  | B | |
| Be | 6.8254 | 6.8249 |  |  |  |  | B | |
Table 2. Experimental peak centroids with statistical errors from 6.6 Å to 6.85 Å of Shot 32 and the present and theoretical wavelength of intense lines in Case B.
In Case A, each of the two stocky peaks is not formed by single transition, but forest of lines, as shown by the theoretical unbroadened lines in Figure  or
or 
 –
–
 , 6.648 Å) contributes most of the intensity of the left peak. The rest part of the two peaks are constructed by transitions from
  to
to  , from
  to
to  and even from
  to
to  . Because these lines are surrounded with the He-
 lines, they are called satellite lines of the He-
 lines. These lines not only huddle together, but also have similar intensities. Even though they are only convolved with an FWHM of 5 m Å, they are indistinguishable. As a result, two stocky peaks are formed, and the Gaussian centroids of the peaks shift a little from the strongest lines. In other words, the satellite lines blend with the He-like lines and affect the line strengths significantly. In Case B, there are also many Li-like lines, but the number of intense lines decreases and their relative intensities are large, so that the peaks become slightly thinner and more distinguishable than Case A.
In the two cases, the He-like ion has a fraction of 96% and 87%, respectively. The energy gaps between the  levels and ground state are larger than 1800 eV. While the electron temperature is several hundreds of eV in the two cases, most of the He-like ions are frozen at the ground state. The fraction of Li-like ion and H-like ion is much smaller than that of He-like ion, so that neither ionization nor recombination processes can populate the resonance line efficiently. Thus, the resonance line is mainly populated by collisional excitation from the tremendous amount of the ground state of He-like ion. Combing with large radiative decay rate, which is
  , the resonance line is the strongest line.
Under such conditions, where temperatures are hundreds of eV, the Li-like ion is easier to be ionized than to be excited by collision, so that the Li-like ion has small populations. However, Li-like lines strongly affect the spectrum profile in the two cases. The reason is that these Li-like lines are populated by dielectronic capture from the ground state of He-like ion, and they also have comparable radiative decay rates with the resonance line. There are two main processes to produce Li-like ions with K-shell vacancies in a collision-dominating plasma, i.e., collisional excitation and dielectronic capture. Because of the small population of Li-like ion, the contribution of collisional excitation is negligible. The Li-like levels, which have K-shell vacancies, usually have large autoionization rates to the ground state of He-like ion. Therefore, dielectron capture, which is the reverse process of autoionization, has large reaction rate while the ground state of He-like ion has tremendous amount. Moreover, the doubly excited Li-like lines usually have comparable radiative decay rates with the resonance line. For example, the radiative decay rate of 
 to
to 
 is
is  . As a result, forest of intense Li-like lines are produced.
However, comparing with those above lines, the intercombination line ( or
or 
 –
–
 and
and 
 –
–
 , 6.688 Å) and the forbidden line (
 or
or 
 –
–
 , 6.74 Å) are weaker. The reason is that the radiative decay rates of these two lines are too small. The A-value of intercombination is
  and
and  for the forbidden lines, which are several orders of magnitude smaller than those intense lines. When there are no other processes to make up this huge disadvantage, the intercombination and forbidden lines are drawn in the Li-like lines.
4 Developed  value and
  value
value
The line  value
value  and
and  value
value  of He-
 lines are widely used in experimental and astrophysical plasma diagnosis[
In the present experimental spectra, the intercombination and forbidden lines are weaker than the Li-like lines, and their positions are occupied by many Li-like lines. It is hard to distinguish these lines clearly and to measure their strengths accurately, and calculations of the line ratios are impossible. So we develop the identification of the  value and
  value, where the contributions of the blending satellite lines are taken into the line intensities. For simplicity, one can think that the three peaks in Figure
  value and
  value[
 and
and  along with electron temperature are plotted in Figure
  and
and  along with electron density are plotted in Figure
As mentioned above, the intercombination and forbidden lines are much weaker than the resonance line, so that the  value is always very small. In Figure
  value is insensitive to electron temperature. The reason is that the energy gap between the resonance line and the forbidden line is about 25 eV, but the temperature in calculation is hundreds of eV. Therefore, the
  value is not obviously influenced by the temperature in this range. The changing of the input parameter is along with changing of ionization degree. When temperature rises, the fraction of Li-like ion decreases and He-like ion increases. The intensities of the lines change with the ions. We also know that the satellite lines enter the peaks a lot, which are at the position of the intercombination and forbidden lines. In consequence,
  is quite large in the low temperature range, and decreases as the temperature rises. With same temperature, the low density case has lower ionization degree than the higher one. Thus, the
  value of the lower density case is larger than that of the higher density case. When ionization degree is high enough, the influence of satellite lines is not important any more, and the
  value converges to the
  value.
The energy gap between the intercombination line and forbidden line is about 15 eV, so that electron temperature and density rarely impact the  value. When the influence of satellite line is concerned, the intensity of the peaks shifts to shorter wavelength range as the ionization degree increases. With same density, the intensity at the lower temperature is larger than in the higher temperature case.
Figure  and
and  values. Cases A and C cooperate with the experiment very well. The difference in Case B is because of the influence of the Cu lines, which enhance the intensities of intercombination and forbidden lines and result in larger
  values than Case B.
When used to diagnose the electron temperature and density of plasma, the traditional  value and
  value are used separately[
 value and
  value are believed to be independent in some range, but they are sensitive to a parameter
  , which is determined by electron temperature and density simultaneously. In the present work, the
  and
and  are sensitive to both electron temperature and density in the given ranges. We think this is more reasonable in diagnosing the plasma, and the electron temperature and density should be determined by the two ratios collectively.
5 Conclusion
Two kinds of shots were performed on Shenguang II laser facility to study the spectroscopy of silicon plasmas under different plasma conditions. The spectra of two types of shots are different, which reveals that the vertical CH foil in the Type II target impacted the evolution of the plasma. X-ray spectra spanning from 6.6 Å to 6.85 Å of collisional silicon plasmas have been recorded with crystal spectrometer. With the radiative-collisional codes[ value and
  value are insensitive to electron temperature and density, and they cannot be used in the diagnosing of electron temperature and density of plasma. We develop the identification of
  value and
  value, where the influence of the satellite lines is taken into the calculations of the line ratios. The developed line ratios,
  and
and  , are influenced by the electron temperature and density, and they can be used in plasma diagnosing in some degree.
References
[1] L. Ji, N. Schulz, M. Nowak, H. L. Marshall, T. Kallman. Astrophys. J., 700, 977(2009).
[4] E. Behar, H. Netzer. Astrophys. J., 570, 165(2002).
[6] A. H. Gabriel, C. Jordan. Nature, 221, 947(1969).
[7] D. Porquet, J. Dubau. Astron. Astrophys. Suppl., 143, 495(2000).
[8] A. H. Gabriel, C. Jordan. Mon. Not. R. Astron. Soc., 145, 241(1969).
[10] H. G. Wei, J. R. Shi, G. Zhao, Z. T. Liang. Astron. Astrophys., 522, A103(2010).
[12] R. D. Cowan. Los Alamos Series in Basic and Applied Sciences(1981).
[13] N. R. Badnell. J. Phys. B: At. Mol. Opt. Phys., 30, 1(1997).
[14] W. Eissner, M. Jones, H. Nussbaumer. Comput. Phys. Commun., 8, 270(1974).
[16] E. Trabert, B. C. Fawcett. J. Phys. B: At. Mol. Phys., 12, L441(1979).
[17] E. Trabert, B. C. Fawcett, J. D. Silver. J. Phys. B: At. Mol. Phys., 15, 3587(1982).
[19] A. Y. Faenov, S. A. Pikuz, A. S. Shlyaptseva. Phys. Scr., 49, 41(1994).
[20] N. Hell, I. Miškovičová, G. V. Brown, J. Wilms, J. Clementson, M. Hanke, P. Beiersdorfer, D. Liedahl, K. Pottschmidt, F. S. Porter, C. A. Kilbourne, R. L. Kelley, M. A. Nowak, N. S. Schulz. Phys. Scr. T, 156(2013).
[23] B. Han, F. Wang, D. Salzmann, G. Zhao. Publ. Astron. Soc. Jpn., 67, 29(2015).
[24] M. F. Gu. Can. J. Phys., 86, 675(2008).
[28] B. Han, F. Wang, G. Liang, G. Zhao. Acta Phys. Sin., 65(2016).
[29] M. Comet, J.-C. Pain, F. Gilleron, R. Piron, D. Denis-Petit, V. Meot, G. Gosselin, P. Morel, F. Hannachi, F. Gobet, M. Tarisien, M. Versteegen. Atomic Processes in Plasmas (APiP 2016), 1811(2017).
[31] D. Porquet, J. Dubau, N. Grosso. Space Sci. Rev., 157, 103(2010).
[32] J. Sylwester, B. Sylwester, K. J. H. Phillips. Astrophys. J. Lett., 681, L117(2008).
[33] F. Wang, B. Han, D. Salzmann, G. Zhao. Phys. Plasmas, 24(2017).

Set citation alerts for the article
Please enter your email address
© Copyright 2018-2021 | Chinese Laser Press. All Rights Reserved 沪ICP备15018463号-20