
Qiaorui Gong, Chengchun Zhao, Yilun Yang, Qiannan Fang, Shanming Li, Min Xu, Yin Hang. Theoretical study on residual infrared absorption of Ti:sapphire laser crystals[J]. Photonics Research, 2021, 9(6): 909
- Photonics Research
- Vol. 9, Issue 6, 909 (2021)
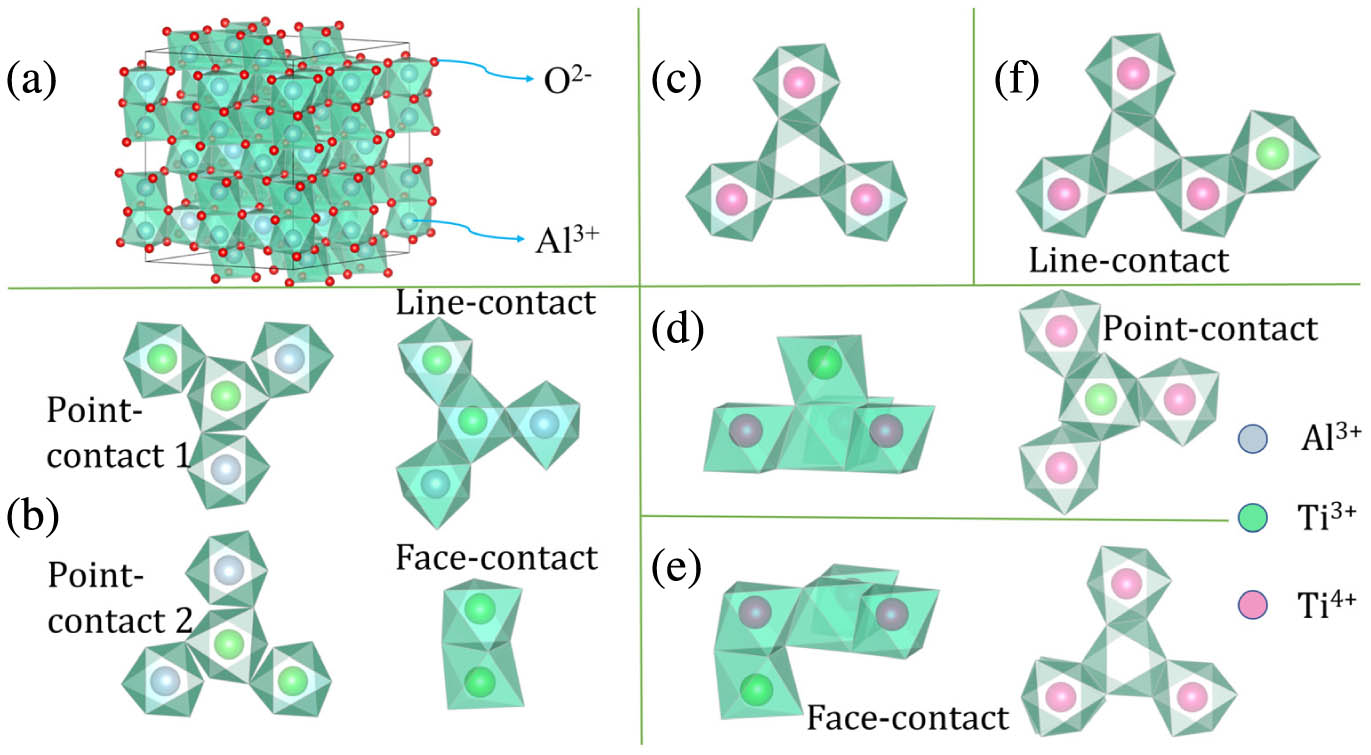
Fig. 1. (a) Supercell structure of Al 2 O 3 Ti 3 + − Ti 3 + 3 Ti 4 + − V Al 3 − Ti 3 + − 3 Ti 4 + − V Al 3 −
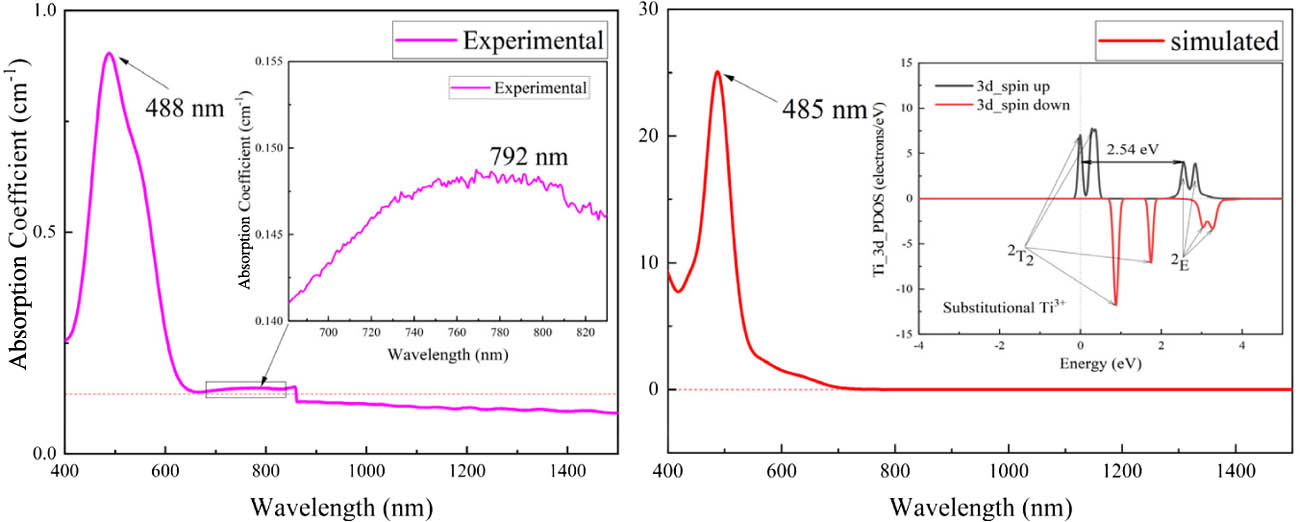
Fig. 2. Experimental absorption spectrum of Ti:sapphire sample with a doping concentration less than 0.16% (mass fraction) (on the left) and the simulated absorption spectrum of substitutional Ti-doped model with a theoretical doping concentration more than 3.6% (mass fraction) (on the right). There is a step at 860 nm on the experimental absorption spectrum, which is caused by the test system. The calculated PDOS distribution of Ti_3d is inserted into the simulated absorption spectrum.
Fig. 3. Band structure (on the left) and polarized absorption spectrum of line-contact Ti 3 + − Ti 3 +
Fig. 4. The DOS of the supercell Ti 2 Al 46 O 72 Ti 3 + − Ti 3 +
Fig. 5. Optimized charge distributions of HOMO, LUMO, and LUMO + i ( i = 1 , 2 , 3 , 4 ) Ti 3 + − Ti 3 + LUMO + 1 LUMO + i
Fig. 6. Band structure, Ti_3d_PDOS, and polarized absorption spectrum of 3 Ti 4 + − V Al 3 −
Fig. 7. Band structure, Ti_3d_PDOS, and polarized absorption spectrum of face-contact Ti 3 + − Ti 4 +
Fig. 8. Optimized charge distributions of HOMO, LUMO, and LUMO + j j = 1 Ti 3 + − Ti 4 + 5 for details).
|
Table 1. Main Parameters and Calculation Results for Four Kinds of
|
Table 2. Band Gap and Total Energy for Three Kinds of

Set citation alerts for the article
Please enter your email address
© Copyright 2018-2021 | Chinese Laser Press. All Rights Reserved 沪ICP备15018463号-20