
Lifang Zhang, Fei Wang, Haidan Zhang, Jianhua Yan, Kefa Cen, "Simultaneous measurement of gas distribution in a premixed flame using adaptive algebraic reconstruction technique based on the absorption spectrum," Chin. Opt. Lett. 14, 111201 (2016)
- Chinese Optics Letters
- Vol. 14, Issue 11, 111201 (2016)
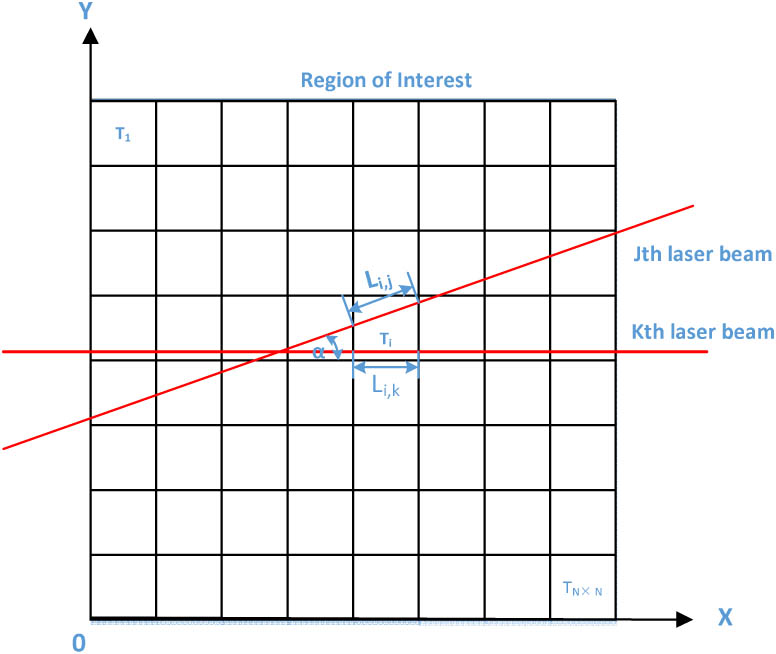
Fig. 1. Schematic view of the optical path calculation in the interested region.
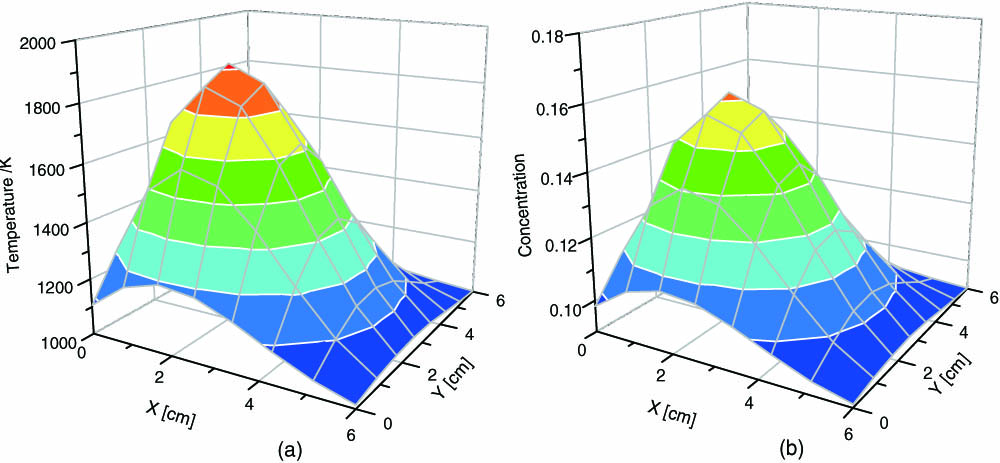
Fig. 2. (a) Assumed two-dimensional temperature distribution; (b) the assumed two-dimensional concentration distribution.
Fig. 3. (a), (b), (c), (d), and (e) Effect of the relaxation parameter λ
Fig. 4. Phantoms for (a), (c), (e), and (g) temperature distribution; (d), (b), (f), and (h) concentration distribution reconstructed with the ART, SIRT, MART, and AART algorithms (0.3% noise levels in the projections).
Fig. 5. (a) Schematic diagram of the experimental arrangement. (b) Optical arrangement using 32 laser beams penetrating the flame region.
Fig. 6. (a) and (b) Reconstructed temperature and concentration distribution of the McKenna burner with 32 laser beams at the equivalence ratio of 1.0.
Fig. 7. Left: center line temperature profile from the reconstructed measurements and the thermocouple traverse from the McKenna burner at the equivalence ratio of 1.0; right: the figure of the McKenna burner at the equivalence ratio of 1.0.
|
Table 1. Specific Parameters of Two H2O Absorption Transitions Near 1397.8 nm


Set citation alerts for the article
Please enter your email address

© Copyright 2018-2021 | Chinese Laser Press. All Rights Reserved 沪ICP备15018463号-20