Lifang Zhang, Fei Wang, Haidan Zhang, Jianhua Yan, Kefa Cen. Simultaneous measurement of gas distribution in a premixed flame using adaptive algebraic reconstruction technique based on the absorption spectrum[J]. Chinese Optics Letters, 2016, 14(11): 111201
Copy Citation Text
Four tomography algorithms, including the algebraic reconstruction technique, simultaneous iterative reconstruction technique, the multiplicative algebraic reconstruction technique, and the adaptive algebraic reconstruction technique (AART), are compared with each other based on the tunable diode laser absorption spectroscopy technique; the determination of the relaxation parameter is discussed to improve reconstruction quality and shorten computational time as much as possible. The calculated results demonstrate that the AART algorithm can produce the reconstruction results with better quality and less computational time. In the experimental measurement, the AART algorithm with a two-line thermometry scheme is adopted to measure the spatial distribution of temperature and concentration, two absorption lines near 1397.8 nm are selected, the temperature and concentration in the McKenna plat premixed flames are experimentally reconstructed and analyzed, and the results of integrated tomography reconstruction are consistent with the thermocouple traverse measurement.
The nonintrusive measurement technology with tunable diode laser absorption spectroscopy (TDLAS) is becoming more and more popular because of its application among different fields, such as the biological, aerostatic, and combustion research areas[1–4]. In combustion research, the distributions of temperature and concentration are quite important for on-line measurement. However, traditional line-of-sight TDLAS can only get the average values of temperature and concentration along a direction of the laser path[5–7]. Recently, many computerized tomography (CT) methods combined with TDLAS have been used to reconstruct the spatial distributions of temperature and gas concentrations in combustion research. Lots of tomography methods have been recommended, such as simulated annealing (SA), weighted back-projection (WBP), maximum likelihood-expectation maximization (ML-EM), the algebraic reconstruction technique (ART), and so on[8–11]. In these different methods, the ART algorithm has been widely applied to many research fields, and based on the ART algorithm many better iterative methods have been further proposed, such as the simultaneous iterative reconstruction technique (SIRT), the multiplicative algebraic reconstruction technique (MART), the simultaneous algebraic reconstruction technique (SART), the adaptive algebraic reconstruction technique (AART), and so on[12–16]. Recently, some of these methods show great reconstructive performance in the combustion field. Li et al. use the modified AART (MAART) method to numerically reconstruct the discrete distribution of temperature and specific gaseous concentrations under incomplete projections. The calculation results obtained by MAART are compared with those obtained by ART and SIRT, and those results demonstrate that the MAART method has great stability and flexibility[17]. Choi et al. adopt the MART algorithm for the temperature and concentration reconstruction in the Bunsen burner[2]. Chen et al. compare the reconstruction error at different iteration numbers with four tomography methods and employ those methods to accurately mimic the three-dimensional droplet movement based on multiple image views, while some specific features of droplets are reconstructed by the MART algorithm from the captured images[18]. Li et al. employ a self-adaptive algebraic tomography algorithm (SAATA) to numerically reconstruct two-dimensional gas distributions[19].
Based on previous studies, numerical simulation is necessarily calculated before the experimental test, the algebraic algorithms, including ART, MART and AART, are numerically compared with each other based on the TDLAS tomography technique, and ratio thermometry from two absorption transitions is employed to reconstruct the image models. The interested region is divided into sub-grids. The number of unknown parameters is 128, including 64 temperature variables and 64 concentration variables, and 32 laser beams pass through the flame region crosswise from multiple image views. In the experimental measurement, a parallel laser-detector pair is used to scan the interested field from multi-views. A distributed feedback (DFB) laser is used to scan two absorption transitions with the central wavelength at 1397 nm, while the temperature and concentration in the McKenna plat premixed flames are experimentally reconstructed and analyzed.
The absorption spectroscopy is fundamentally expressed by the Beer–Lambert relationship, the spectrally integrated absorbance of the selected transition is straightforward and formulated as where and represent the transmitted and original laser intensities, respectively.
Sign up for Chinese Optics Letters TOC. Get the latest issue of Chinese Optics Letters delivered right to you!Sign up now
The spectral absorption transitions of and are selected for two-dimensional temperature and concentration measurements in the numerical simulation and the experimental measurement. The parameters of two transitions are listed in Table 1 in detail, and more information about the two transitions can be obtained in Ref. [11].
Line index
Frequency [cm−1]
S (296 K) [cm−2atm−1]
E′′ [cm−1]
1
7153.722
1.90×10⁻⁶
2552.8796
7153.74842
5.50×10⁻⁶
2552.8572
2
7154.35436
3.85×10⁻⁴
1789.0428
Table 1. Specific Parameters of Two H2O Absorption Transitions Near 1397.8 nm
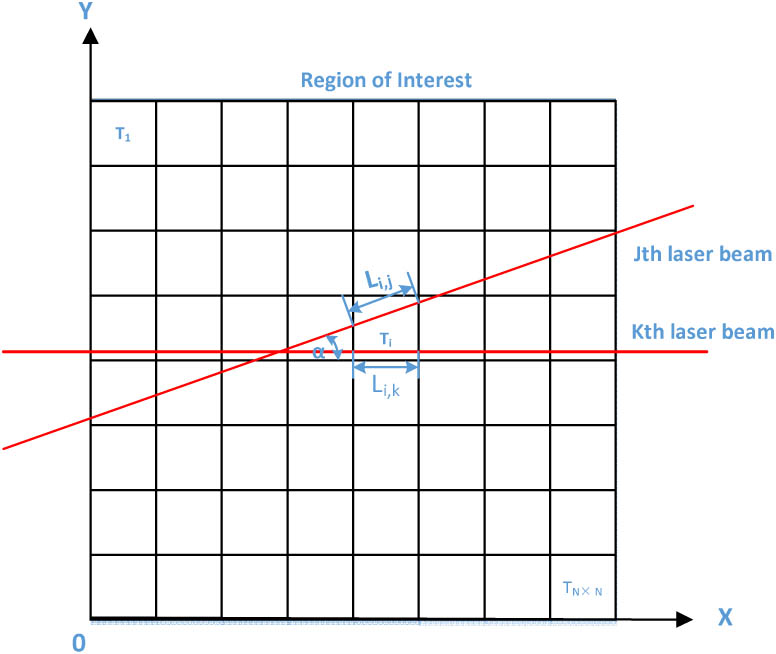
The optical arrangement and mesh generation are very significant for obtaining more accurate temperature and concentration distribution. The selected absorption transitions are performed along the same optical path length from multiple image views, and the measuring field is divided into four-square sub-grids, as shown in Fig. 1.
Figure 1.Schematic view of the optical path calculation in the interested region.
When th laser beam passes through the sub-grid , the optical pathlength can be simply calculated based on the optical path layout and beam direction , and the integrated absorption of the th laser beam can be simply represented as where denotes the total absorption coefficient in each grid.
The ART algorithm is the primary iterative solver, which is very appropriate for the linear problem of tomographic reconstruction. The key idea of the ART algorithm is that the algorithm uses specific optimization rules to gradually update and approximate the actual coefficient vector based on the difference between the measured and virtual projections[20]. Based on the Eq. (2), the iterative expression of the ART method could be mathematically expressed as follows: where is the relaxation parameter, which is used to get speedy convergence and high quality reconstruction.
The SIRT algorithm provides a least square solution for the integral absorption equation based on the ART algorithm, simultaneously considering all of the projections for every iteration, and can get better reconstruction quality by sacrificing computing time[21]. The iterative expression of the SIRT algorithm is This method updates the sub-grid values after all of the equations have been gone through at each iteration, and then the iterative progress is repeated until the iterative process stops.
The MART algorithm was first proposed by Gordon[22] in 1974. Being different from the conventional ART algorithm, the MART algorithm uses an element of a multiplicative correction to reconstruct the projections, and the multiplicative MART can be expressed as follows: where the normalized weighting factor , is the largest value in the whole projection matrix , and the original element of must be nonzero in the MART algorithm in order to guarantee the iterative process is accomplished smoothly.
In the AART algorithm, the iterative expression could be mathematically expressed as follows:
The excellent reconstructed results with rapid convergence can be obtained by the AART algorithm because of the modified adaptive step, , where represents a constant value in the iterative procedure of the AART algorithm, and more detailed information about the AART algorithm can be found in Ref. [16].
So to accurately show the two-dimensional temperature and concentration phantoms, a single-peak Gaussian function is used to create two models of the temperature and concentration distribution, as shown in Fig. 2. The numerical simulation is used to study and compare the reconstructed results obtained by the four iterative algorithms with different relaxation parameters.
Figure 2.(a) Assumed two-dimensional temperature distribution; (b) the assumed two-dimensional concentration distribution.
For objectively assessing the reconstruction quality, the mean error and correlation of the temperature and concentration are used, and can be simply defined as follows: where and represent the actual values and the reconstructed values in each sub-grid, and and represent the average values, respectively[12,16].
A series of simulations are carried out to select an optimal relaxation parameter for the four iterative algorithms, as mentioned earlier for obtaining a speedy convergence and high reconstructed quality. Figures 3(a)–3(e) show the mean errors ( and ), correlations ( and ), and the iteration time () of the reconstructed values against the relaxation parameter () for the four iterative algorithms, respectively, and Fig. 3(f) shows the mean error of the reconstructed values against the iterative number.
Figure 3.(a), (b), (c), (d), and (e) Effect of the relaxation parameter on the reconstruction errors, correlations, and iteration time for different iterative algorithms, and (f) the iteration number on the reconstruction errors.
Those plots show that with the linear increase of the relaxation coefficient, the mean errors ( and ) gradually decrease, while the correlations ( and ) increase, and the iteration time of the reconstructed values decrease slightly for all of the four iterative algorithms. After that, the mean errors, correlations, and iteration times would almost not change anymore with the increase in . As shown in Fig. 3, the ART, SIRT, MART, and AART algorithms get the best reconstructed results, respectively, at the relaxation coefficients of 0.3, 0.4, 0.4, and 0.3. As it can be seen, the AART algorithm is the best method for two-dimensional reconstruction according to the mean errors, correlation, and iteration time. While the MART algorithm can give comparable results with the AART at the optimal relaxation parameter, the MART algorithm needs a little more iteration time, but the SIRT algorithm needs the most computational time, as can be seen from Fig. 3(e). The results of the SIRT algorithm are much better than those of the ART algorithm, but slightly worse than those reconstructed with the MART and AART, because of the lower reconstruction quality and the slowest convergence speed.
As can be seen in Fig. 3(f), with the best relaxation coefficient, the mean error () curves of the four algorithms over the 1400 iterative cycles are plotted in Fig. 3(f). The curves are smooth and decrease monotonically, showing that the iteration process continues to converge. Finally, of the ART, MART, and AART algorithms reach 1.45%, 1.09%, and 1.08%, but the SIRT doesn’t converge until the 1400 iterative cycles because of the increased computational time. The simulated results show that the AART performs better compared with the other three algorithms, and the AART converges rapidly in the simulated results.
Considering the higher reconstruction quality, this paper further compares the reconstructed results, which are calculated by the ART, SIRT, MART, and AART algorithms at the optimal relaxation parameter, respectively. The reconstructed phantoms with 0.3% noise levels in projections are plotted in Figs. 4(a)–4(h). From Fig. 4, it can be seen that the temperature and concentration distributions are reconstructed with better agreement using the MART and AART algorithms, while the shapes of the two-dimensional temperature and concentration are comparatively rough, which are calculated by the ART and SIRT algorithms. The ART algorithm generates and within 2.08% and 1.86%, the SIRT algorithm generates and within 1.98% and 1.83%, the AART algorithm controls and within 1.64% and 1.58%, and the MART algorithm controls and within 1.77% and 1.60%, respectively.
Figure 4.Phantoms for (a), (c), (e), and (g) temperature distribution; (d), (b), (f), and (h) concentration distribution reconstructed with the ART, SIRT, MART, and AART algorithms (0.3% noise levels in the projections).
Those results indicate that the AART algorithm can reconstruct much better results with the limited views, so the AART are used to further study the two-dimensional reconstruction in premixed methane/air flames.
The verified experiment is conducted in a McKenna burner; the schematic overview of this experimental system and the optical layout are given in Figs. 5(a) and 5(b). Figure 5(a) shows the schematic diagram of the experimental arrangement, which is used for quantitative measurements of temperature and concentration distribution in the McKenna burner. Laser beam from a single-mode fiber is collimated by a collimating lens, then propagated across the combustion flame, and finally detected by photoelectric sensor. In order to be scanned, the McKenna burner is mounted onto a two-dimensional revolving platform, where the diode laser and the detector are symmetrically mounted on two fixing stages to scan the combustion flame from a multi-view (0°, 45°, 90°, and 135°). A total of 32 laser beams fold across the flame region. The area of the measuring field is , the cross section is divided into sub-grids, and the spatial resolution is 7.5 mm, as shown in Fig. 5(b).
Figure 5.(a) Schematic diagram of the experimental arrangement. (b) Optical arrangement using 32 laser beams penetrating the flame region.
In this study, the optical plane is located only 5 mm above the top of the burner spout, so that the steady and uniform flame can be measured. To make the fuel gas fully burning and obtain a stable flat flame, the experiment is finished with the combustion equivalence ratio of 1.0.
The reconstructed results of the temperature and concentration with 32 beams at the equivalence ratio of 1.0 are shown in Fig. 6. The non-uniform temperature is calculated using the AART, where a lower temperature region appears in the four corners of the McKenna burner, and an approximately uniform temperature and concentration region appears in the central area of McKenna burner. The variation of the temperature in the combustion region is between 1000 and 1500 K under the equivalence ratio of 1.0, and the range of the concentration is between 12.35% and 22.80%, which is a little bit higher compared with the theoretical average value of 18.55%, which is calculated by the Chemkin using a GRI-Mech Version 3.0 mechanism.
Figure 6.(a) and (b) Reconstructed temperature and concentration distribution of the McKenna burner with 32 laser beams at the equivalence ratio of 1.0.
Figure 7 provides a comparison of the center line temperature profiles, respectively obtained by the two-wavelength scheme with the AART and the thermocouple measurement at the equivalence ratio of 1.0. The reconstructed temperature with the two-wavelength scheme is much lower, at about 100 K, than the temperature measured by the platinum–rhodium thermocouple (B type) in the boundary zone; the temperatures in the central region are agreement with the thermocouple measurement.
Figure 7.Left: center line temperature profile from the reconstructed measurements and the thermocouple traverse from the McKenna burner at the equivalence ratio of 1.0; right: the figure of the McKenna burner at the equivalence ratio of 1.0.
In conclusion, we compare four tomography algorithms based on TDLAS. The numerically reconstructed results indicate that the AART can greatly improve the reconstruction quality and reduce the computational burden. Another important advantage of the AART algorithm is the better stability when the projections have different levels of noise. Two-dimensional temperature and concentration distributions are demonstrated in the theoretical and experimental reconstruction with the AART algorithm using a two-line thermometry scheme. A square grid of is superimposed using 32 laser beams at multi-views with a fixed location. The experimental measurements demonstrate that the AART algorithm is suitable for two-dimensional distribution of temperature and concentration in a combustion flame, and the TDLAS technique could be a very useful tool for on-line monitoring of combustion.
Lifang Zhang, Fei Wang, Haidan Zhang, Jianhua Yan, Kefa Cen. Simultaneous measurement of gas distribution in a premixed flame using adaptive algebraic reconstruction technique based on the absorption spectrum[J]. Chinese Optics Letters, 2016, 14(11): 111201