
Yu-hui ZHAO, Peng-cheng LU, Yu-bo LUO, Peng SHAN. NIR Calibration Transfer Method Based on Minimizing Mean Distribution Discrepancy[J]. Spectroscopy and Spectral Analysis, 2021, 41(10): 3051
- Spectroscopy and Spectral Analysis
- Vol. 41, Issue 10, 3051 (2021)
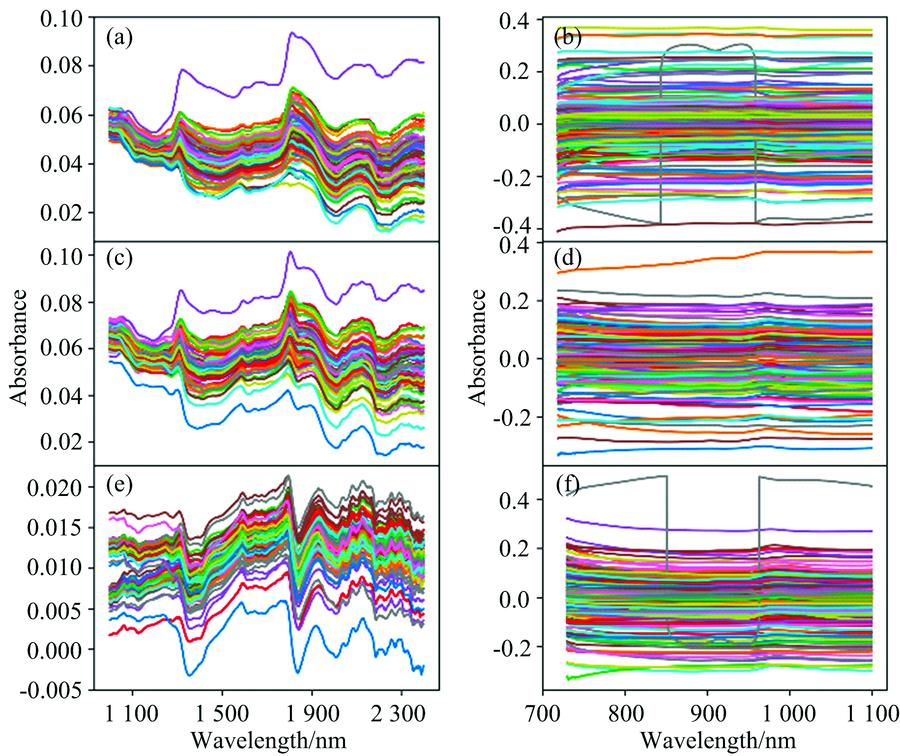
Fig. 1. Spectral difference between different instruments
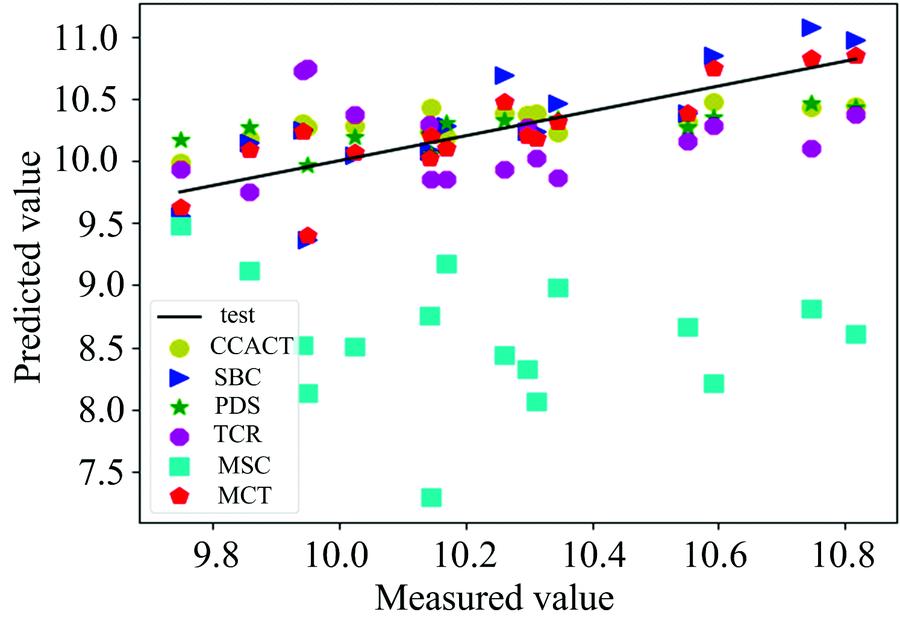
Fig. 2. Scatter plots for prediction between instruments M5 and MP5 in SBC, PDS, CCACT, TCR, MSC and MCT
Fig. 3. Scatter plots for prediction between instruments M5 and MP6 in SBC, PDS, CCACT, TCR, MSC and MCT
Fig. 4. Scatter plots for prediction between instruments MP5 and MP6 in SBC, PDS, CCACT, TCR, MSC and MCT
Fig. 5. Scatter plots for prediction between instruments A2 and A1 in SBC, PDS, CCACT, TCR, MSC and MCT
Fig. 6. Scatter plots of prediction results between instruments A3 and A2 by SBC, PDS, CCACT, TCR, MSC and MCT
Fig. 7. Scatter plots of prediction results between instruments A2 and A3 by SBC, PDS, CCACT, TCR, MSC and MCT
| ||||||||||||||||||||||||||||||||||||||||||||||||||||||||||||||||||||||||||||||||||||||||||||||||||||||||||||||||
Table 1. RMSEC and RMSEP of corn datasets with SBC, PDS, TCR, CCACT, MSC and MCT
| ||||||||||||||||||||||||||||||||||||||||||||||||||||||||||||||||||||||||||||||||||||||||||||||||||||||||||||||||
Table 2. RMSEC and RMSEP of wheat datasets with SBC, PDS, TCR, CCACT, MSC and MCT
| |||||||||||||||||||||||||||||||||||||||||||||||||||||||
Table 3. Slope comparison of predicted results of SBC, PDS, TCR, CCACT, MSC and MCT


Set citation alerts for the article
Please enter your email address

© Copyright 2018-2021 | Chinese Laser Press. All Rights Reserved 沪ICP备15018463号-20