• Acta Optica Sinica
  • Vol. 42, Issue 2, 0210003 (2022)
Yu Zhang, Yan Zhang*, Zhiguang Shi, Jinghua Zhang, Di Liu, Yuchang Suo, Xiaoran Shi, and Jinming Du
Author Affiliations
  • National Key Laboratory of Science and Technology on Automatic Target Recognition, College of Electronic Science and Technology, National University of Defense Technology, Changsha, Hunan 410073, China
  • show less
    DOI: 10.3788/AOS202242.0210003 Cite this Article Set citation alerts
    Yu Zhang, Yan Zhang, Zhiguang Shi, Jinghua Zhang, Di Liu, Yuchang Suo, Xiaoran Shi, Jinming Du. Image Simulation Method of Infrared UAV Based on Image Derivation[J]. Acta Optica Sinica, 2022, 42(2): 0210003 Copy Citation Text show less
    Processing flow of UAV group infrared image simulation method based on image derivation
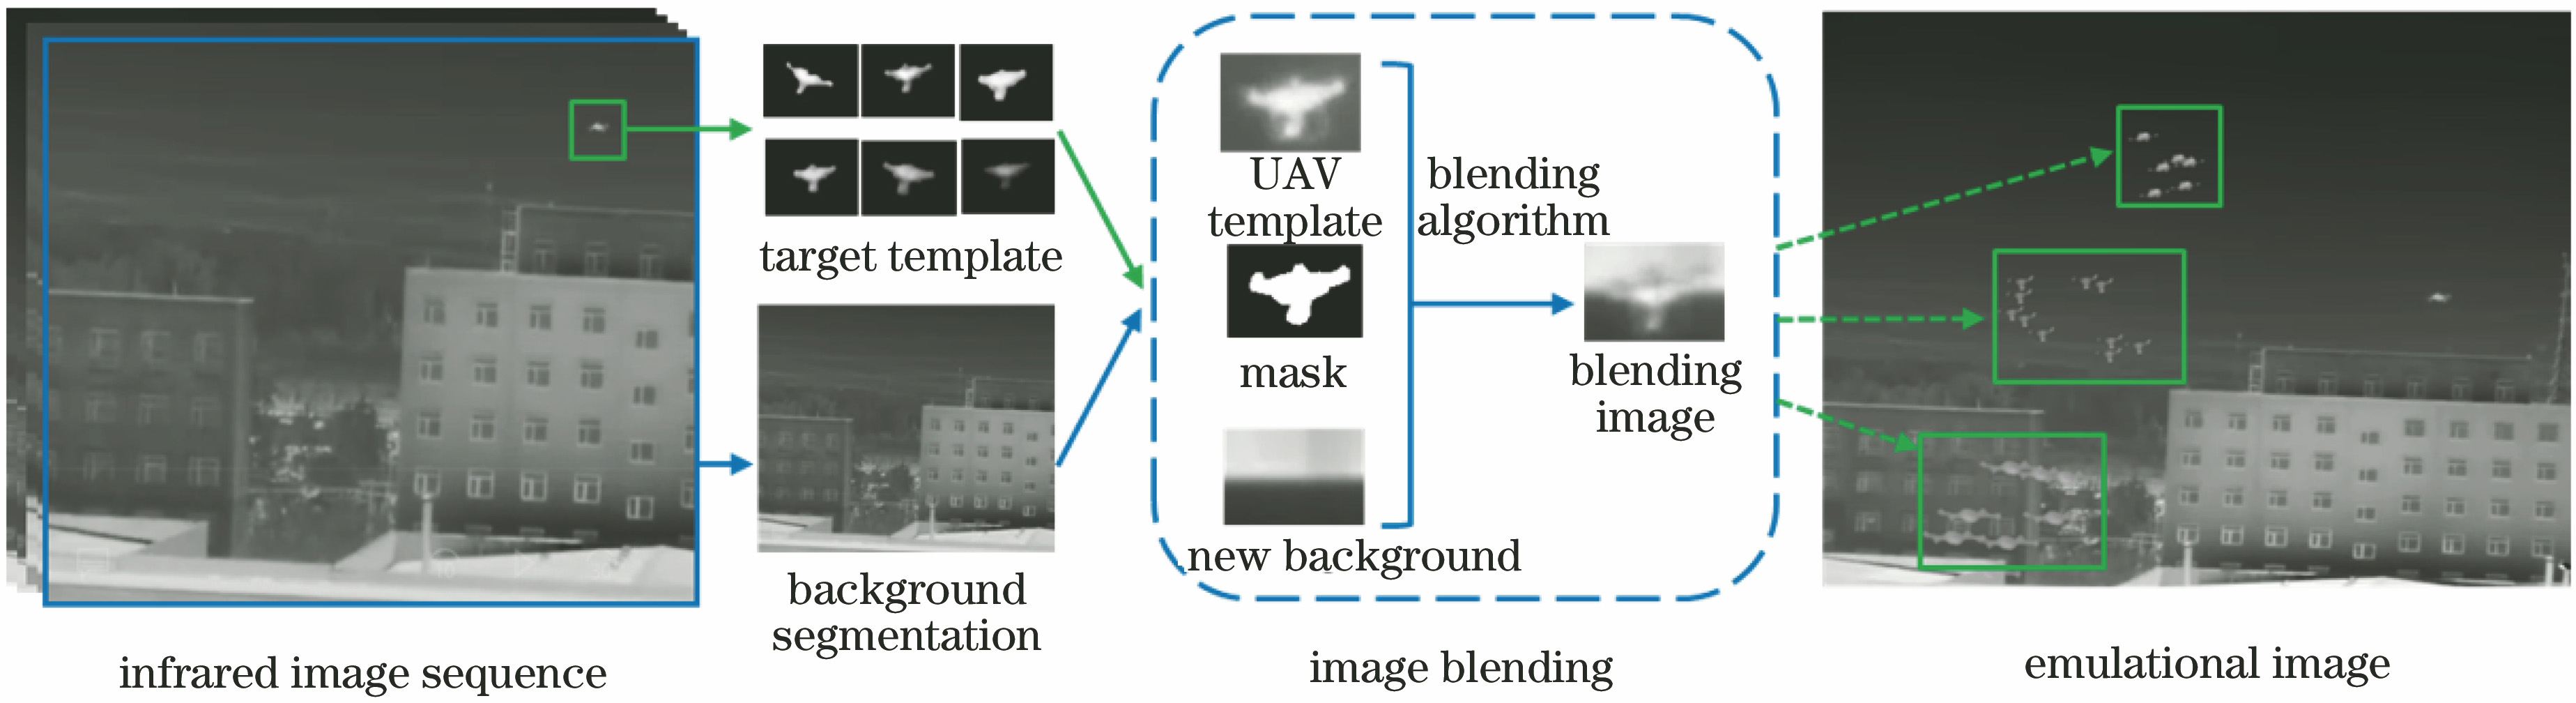
    Fig. 1. Processing flow of UAV group infrared image simulation method based on image derivation
    Overall processing flow of infrared UAV image blending method based on ED-GAN
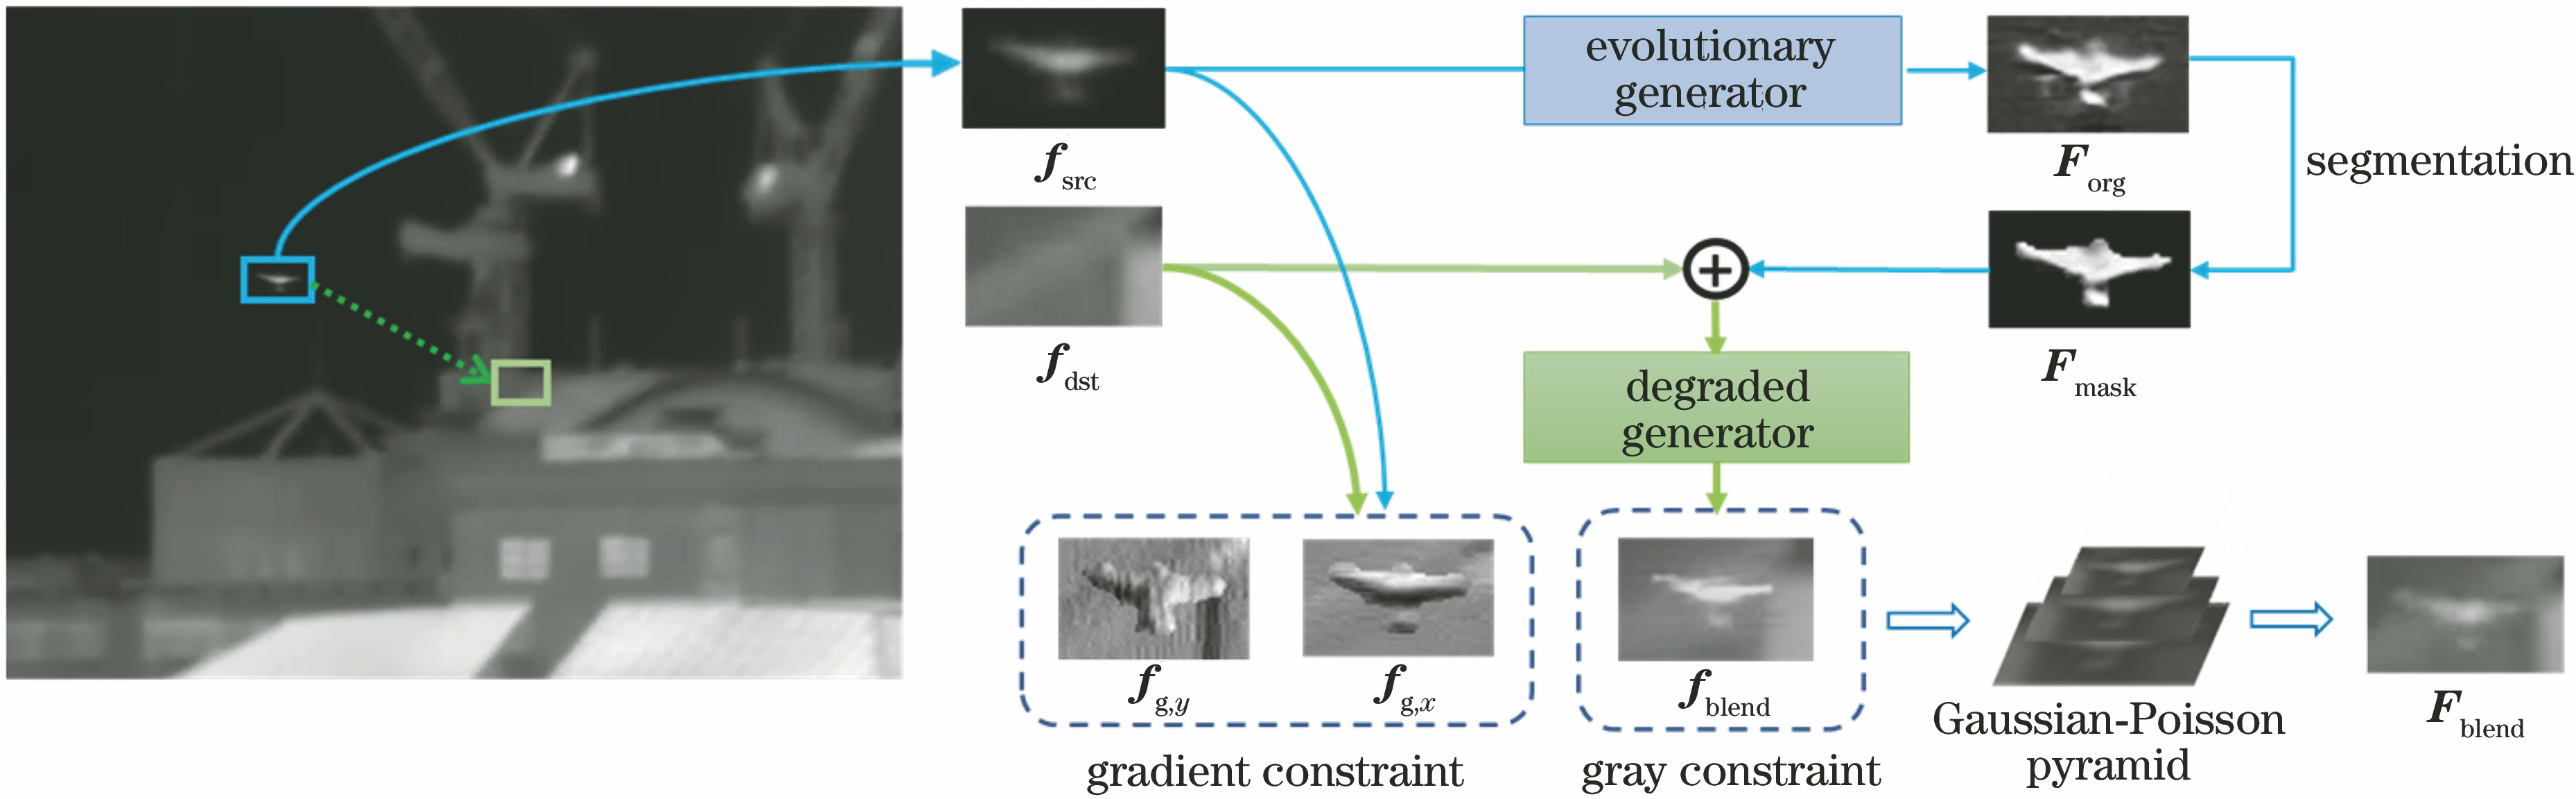
    Fig. 2. Overall processing flow of infrared UAV image blending method based on ED-GAN
    Template images and magnified image of infrared UAV
    Fig. 3. Template images and magnified image of infrared UAV
    Structure diagram of ED-GAN
    Fig. 4. Structure diagram of ED-GAN
    Image from image degradation-recovery dataset
    Fig. 5. Image from image degradation-recovery dataset
    Multi-task pre-training process supervised by ED-GAN
    Fig. 6. Multi-task pre-training process supervised by ED-GAN
    Unsupervised model migration in ED-GAN
    Fig. 7. Unsupervised model migration in ED-GAN
    Sketch of shape and infrared image of small UAV. (a) UAV profile; (b) infrared images
    Fig. 8. Sketch of shape and infrared image of small UAV. (a) UAV profile; (b) infrared images
    Schematic comparison of output images of evolution generator with original images
    Fig. 9. Schematic comparison of output images of evolution generator with original images
    Schematic comparison of output images of degraded generator with original images
    Fig. 10. Schematic comparison of output images of degraded generator with original images
    Qualitative experimental results of proposed method under different complex backgrounds and their partial enlarged images. (a) Mountain background; (b) woodland background; (c) sky and cloud background; (d) building group background
    Fig. 11. Qualitative experimental results of proposed method under different complex backgrounds and their partial enlarged images. (a) Mountain background; (b) woodland background; (c) sky and cloud background; (d) building group background
    Qualitative results of proposed method and other mixed image methods. (a) Copy and paste images; (b) PB method; (c) MPB method; (d) PR-GAN method; (e) GP-GAN method; (f) ED_org method; (g) ED_sup method; (h) ED_usup method
    Fig. 12. Qualitative results of proposed method and other mixed image methods. (a) Copy and paste images; (b) PB method; (c) MPB method; (d) PR-GAN method; (e) GP-GAN method; (f) ED_org method; (g) ED_sup method; (h) ED_usup method
    P-R curves of each detector model in different datasets. (a) P-R curves of HB in DS when IoU threshold is 0.50; (b) P-R curves of HB in DS when IoU threshold is 0.75; (c) P-R curves of HO in DB when IoU threshold is 0.50; (d) P-R curves of HO in DB when IoU threshold is 0.75
    Fig. 13. P-R curves of each detector model in different datasets. (a) P-R curves of HB in DS when IoU threshold is 0.50; (b) P-R curves of HB in DS when IoU threshold is 0.75; (c) P-R curves of HO in DB when IoU threshold is 0.50; (d) P-R curves of HO in DB when IoU threshold is 0.75
    MethodfsrcFsrcS
    Brenner0.664×1062.553×1062.893×106
    FBrenner0.287×1061.380×1061.521×106
    Laplacian0.650×1025.862×1026.734×102
    SMD3.263×1053.976×1054.019×105
    SMD20.702×1053.254×1054.158×105
    Variance5.248×1066.329×1066.403×106
    Vollath4.843×1065.558×1065.638×106
    Table 1. Quantitative evaluation of defuzzy tasks by evolutionary generators
    Evaluation indicatorforg-fsrcforg-Fsrc
    SSIM6.983×10-18.717×10⁻¹
    PSNR1.843×1022.263×102
    CS7.881×10-17.924×10⁻¹
    MI3.943×10-19.310×10⁻¹
    L12.018×1062.030×106
    L21.642×1061.715×106
    HIST2.667×10-13.582×10⁻¹
    Table 2. Quantitative evaluation of reconstruction tasks by degraded generator
    MethodPBMPBPR-GANGP-GANED_orgED_supED_usup
    Realism score-0.08382-0.07729-0.06509-0.06072-0.05992-0.05502-0.05227
    Table 3. Comparison of truth index of different methods
    IndicatorALFPBMPBPR-GANGP-GANED_orgED_supED_usup
    L500.6610.7470.8650.8820.9210.9030.9440.972
    L750.6190.7100.7730.8150.9020.8890.9270.956
    LF10.6540.7280.6940.7030.8440.8020.8540.867
    Table 4. Comparison of empirical consistency loss between proposed method and other image mixing methods
    Yu Zhang, Yan Zhang, Zhiguang Shi, Jinghua Zhang, Di Liu, Yuchang Suo, Xiaoran Shi, Jinming Du. Image Simulation Method of Infrared UAV Based on Image Derivation[J]. Acta Optica Sinica, 2022, 42(2): 0210003
    Download Citation