
Qun Yu, Cunshan Wang, Chuang Dong. Microstructure and Properties of Ni-Cr-Al Basic Alloys Fabricated by Laser Additive Manufacturing[J]. Chinese Journal of Lasers, 2022, 49(14): 1402002
- Chinese Journal of Lasers
- Vol. 49, Issue 14, 1402002 (2022)
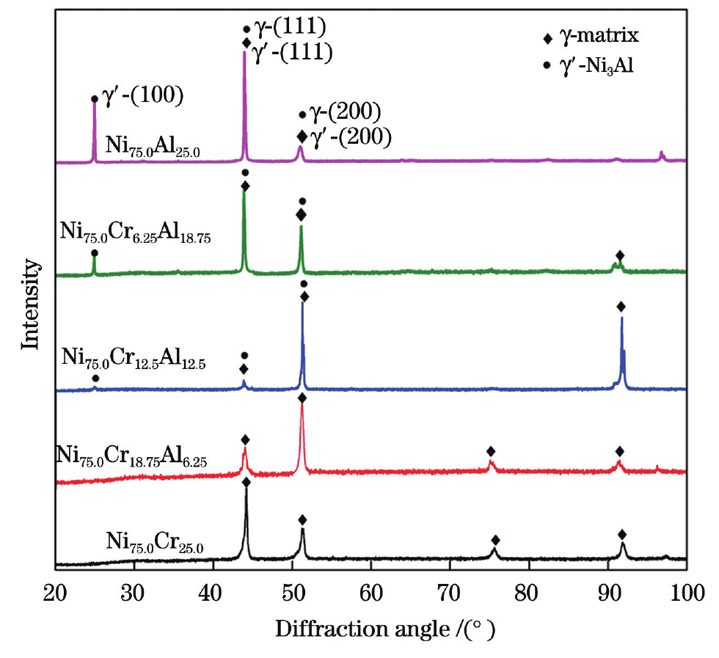
Fig. 1. X-ray diffraction patterns of as-deposited alloys with different compositions

Fig. 2. Typical microstructural morphologies of as-deposited alloys with different compositions. (a) Ni75.0Cr25.0alloy; (b) Ni75.0Cr18.75Al6.25alloy; (c) Ni75.0Cr12.5Al12.5alloy; (d) Ni75.0Cr6.25Al18.75alloy; (e) Ni75.0Al25.0alloy
Fig. 3. TEM images taken from as-deposited Ni75.0Cr12.5Al12.5 alloy. (a) Bright-field image of γ′-Ni3Al phase; (b) electron diffraction pattern of γ′-Ni3Al phase
Fig. 4. Influence of Al content on microhardness of as-deposited alloys
Fig. 5. Compressive stress-strain curves of as-deposited alloys with different compositions
Fig. 6. Typical compressed surface morphologies of as-deposited alloys with different compositions. (a) Ni75.0Cr25.0alloy; (b) Ni75.0Cr18.75Al6.25alloy; (c) Ni75.0Cr12.5Al12.5alloy; (d) Ni75.0Cr6.25Al18.75alloy; (e) Ni75.0Al25.0alloy
Fig. 7. Continuous variable-temperature oxidation kinetic curves of as-deposited alloys with different compositions
Fig. 8. Oxidized surface morphologies of as-deposited alloys with different compositions. (a) Ni75.0Cr25.0 alloy; (b) Ni75.0Cr18.75Al6.25 alloy; (c) Ni75.0Cr12.5Al12.5 alloy; (d) Ni75.0Cr6.25Al18.75 alloy; (e) Ni75.0Al25.0 alloy
Fig. 9. X-ray diffraction patterns of oxidized surfaces of as-deposited alloys with different compositions
Fig. 10. Low magnification microstructure of as-deposited alloys. (a)(b)(c) Ni75.0Cr25.0 alloy; (d)(e)(f) Ni75.0Cr18.75Al6.25 alloy; (g)(h)(i) Ni75.0Cr12.5Al12.5 alloy; (j)(k)(l) Ni75.0Cr6.25Al18.75 alloy; (m)(n)(o) Ni75.0Al25.0 alloy
Fig. 11. DSC thermal curves of as-deposited alloys with different compositions
| |||||||||||||||||||||||||||
Table 1. Chemical compositions of alloys
|
Table 2. Lattice constants and misfits of γ and γ′ phases
| |||||||||||||||||||||||||||||||||||||||||||||||||||||
Table 3. Compositions of typical region from as-deposited alloys with different compositions
|
Table 4. Compressive strength and plasticity of as-deposited alloys with different compositions
|
Table 5. Oxidation kinetics data of as-deposited alloys with different compositions
| ||||||||||||||||||||||||||||||||||||||||||||||||||||||||||||
Table 6. Chemical compositions of typical areas taken from oxidized surfaces of as-deposited alloys with different compositions
|
Table 7. Solidification intervals of as-deposited alloys

Set citation alerts for the article
Please enter your email address
© Copyright 2018-2021 | Chinese Laser Press. All Rights Reserved 沪ICP备15018463号-20