• Acta Optica Sinica
  • Vol. 43, Issue 6, 0601001 (2023)
Haojia Zhang1、2, Gang Sun1、*, Liming Zhu1、2, Hanjiu Zhang1、3, Xuebin Ma1、2, Xiaodan Hu1、2, Zihan Zhang1、2, Ying Liu1、3, and Xuebin Li1
Author Affiliations
  • 1Key Laboratory of Atmospheric Optics, Anhui Institute of Optics and Fine Mechanics, Hefei Institutes of Physical Science, Chinese Academy of Sciences, Hefei 230031, Anhui, China
  • 2Science Island Branch of Graduates School, University of Science and Technology of China, Hefei 230026, Anhui, China
  • 3School of Environmental Science and Optoelectronic Technology, University of Science and Technology of China, Hefei 230031, Anhui, China
  • show less
    DOI: 10.3788/AOS221007 Cite this Article Set citation alerts
    Haojia Zhang, Gang Sun, Liming Zhu, Hanjiu Zhang, Xuebin Ma, Xiaodan Hu, Zihan Zhang, Ying Liu, Xuebin Li. Estimation of Optical Turbulence Intensity near Sea Surface Using Ultrasonic Anemometer Array[J]. Acta Optica Sinica, 2023, 43(6): 0601001 Copy Citation Text show less
    Experimental site and measurement equipment
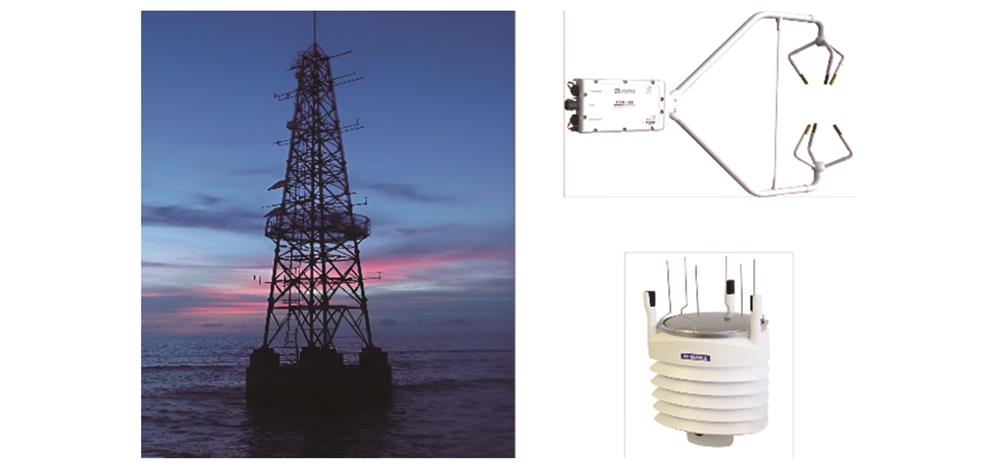
    Fig. 1. Experimental site and measurement equipment
    Ultrasonic data processing process
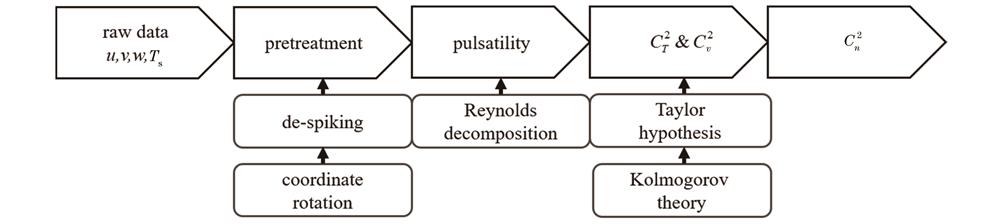
    Fig. 2. Ultrasonic data processing process
    Cn2 comparison
    Fig. 3. Cn2 comparison
    Temperature change and temperature gradient change. (a) Temperature change; (b) temperature gradient change
    Fig. 4. Temperature change and temperature gradient change. (a) Temperature change; (b) temperature gradient change
    Wind speed, wind shear change, and turbulence intensity change. (a) Wind speed and wind shear change; (b) turbulence intensity change
    Fig. 5. Wind speed, wind shear change, and turbulence intensity change. (a) Wind speed and wind shear change; (b) turbulence intensity change
    Cn2 correlation diagram
    Fig. 6. Cn2 correlation diagram
    z/L varying with time
    Fig. 7. z/L varying with time
    Cn2 varying with z/L
    Fig. 8. Cn2 varying with z/L
    InstrumentVariableResolutionRange
    CSAT3Bu1.0 mm·s-1-32.8-32.8 m·s-1
    v1.0 mm·s-1-32.8-32.8 m·s-1
    w0.5 mm·s-1-65.5-65.5 m·s-1
    Ts±0.002 ℃-30-50 ℃
    WXT536P0.1 hPa600-1100 hPa
    T0.1 ℃-52-60 °C
    RH0.1%0-100%
    Table 1. Main indicators of measurement equipment
    Run number

    Run. 20

    (February 20,2021)

    Run. 47

    (March 30,2021)

    Run. 80(April 27,2021)Run. 87(May 3,2021)Run. 120(June 16,2021)
    CT2_Cn2/10-16 m-2/325.39.389.5915.821.2
    Cv2_Cn2/10-16 m-2/32.5410.715.730.68.14
    Δlg Cn20.980.060.210.290.41
    R0.840.860.960.980.71
    Table 2. Comparison of results of two calculation methods for five typical runs
    Meteorological parameterTs /ΔT /RH /%U /ms-1S /s-1Cv2 /m-2/3
    Cn2 obtained by ultrasonic anemometer array calculation methodWhole day on April 270.750.50-0.830.180.44-0.04
    Daytime on April 270.83-0.11-0.810.160.230.10
    Night on April 27-0.44-0.41-0.210.810.800.89
    Cn2 obtained by ultrasonic single point virtual temperature estimation methodWhole day on April 270.710.38-0.810.250.550.98
    Daytime on April 270.91-0.22-0.820.060.280.98
    Night on April 27-0.56-0.55-0.290.940.930.98
    Table 3. Correlation between Cn2 and meteorological parameters of Run. 80
    Haojia Zhang, Gang Sun, Liming Zhu, Hanjiu Zhang, Xuebin Ma, Xiaodan Hu, Zihan Zhang, Ying Liu, Xuebin Li. Estimation of Optical Turbulence Intensity near Sea Surface Using Ultrasonic Anemometer Array[J]. Acta Optica Sinica, 2023, 43(6): 0601001
    Download Citation