
Xiao-Lei Wang, Jie-Hui Zhao, Miao Li, Guang-Ke Jiang, Xiao-Xue Hu, Nan Zhang, Hong-Chen Zhai, Wei-Wei Liu. Tight focus and field enhancement of terahertz waves using a probe based on spoof surface plasmons [J]. Acta Physica Sinica, 2020, 69(5): 054201-1
- Acta Physica Sinica
- Vol. 69, Issue 5, 054201-1 (2020)
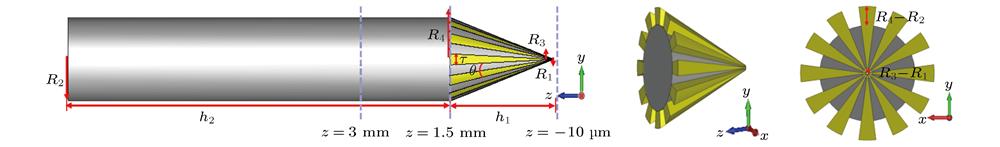
Fig. 1. Thickness gradient silver plated strip probe schematic and the magnified schematic diagram of the structure at the tip in the different planes.
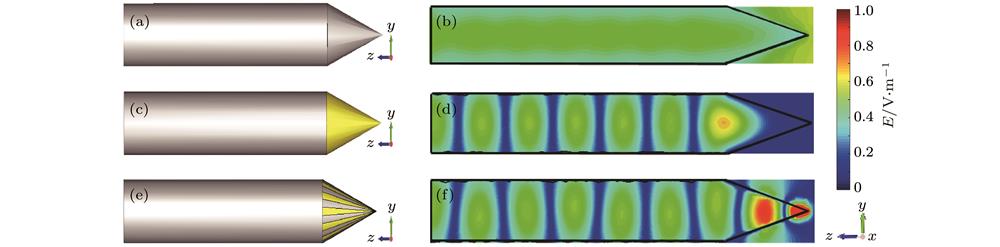
Fig. 2. Structure of the three probes and light field distribution in the y -z plane: (a) A Teflon probe structure; (b) light field distribution of a Teflon probe in the y -z plane; (c) a fully silver-plated probe structure; (d) light field distribution at the tip of a fully silver-plated probe in the y -z plane; (e) a thickness-graded silver-plated strip probe structure; (f) light field distribution of a thickness-graded silver-plated strip probe in the y -z plane.
Fig. 3. Peak electric field intensity distribution and normalized electric field intensity distribution curve along the probe centerline (y = 0) in the y -z plane: (a) The light field distribution at the tip of a thickness-graded silver-plated strip probe; (b) the normalized electric field intensity distribution curve.
Fig. 4. Distribution of electric field intensity of three kinds of probes in x -y plane.
Fig. 5. The electric field strength at the tip of the thickness-graded silver-plated strip probe is distributed in the x -y plane when the polarization directions of the incident terahertz waves are different. The first row to the fourth row are the tightly focused electric field intensity distributions of the incident wave along the y -axis polarization, the x -axis polarization, the left-hand circular polarization, and the right-hand circular polarization. The first to fourth columns are the Ex component, Ey component, Ez component, and E total of the tightly focused electric field, respectively.
Fig. 6. Surface current and tightly focused electric field intensity curves of the thickness-graded silver-plated strip probe structure corresponding to different θ values. The first to fourth rows are the cases of θ = 30°, 45°, 60°, and 90°, respectively. The first to third columns are the probe structure, the surface current distribution, and the normalized electric field intensity of tightly focused light field in the x -y plane, respectively.
|
Table 1.
Emax/E0 and FWHM corresponding to different θ values.
不同θ值所对应的Emax/E0和FWHM

Set citation alerts for the article
Please enter your email address
© Copyright 2018-2021 | Chinese Laser Press. All Rights Reserved 沪ICP备15018463号-20