
Shan Zhang, Shikang Li, Xue Feng, Kaiyu Cui, Fang Liu, Wei Zhang, Yidong Huang. Generating heralded single photons with a switchable orbital angular momentum mode[J]. Photonics Research, 2021, 9(9): 1865
- Photonics Research
- Vol. 9, Issue 9, 1865 (2021)
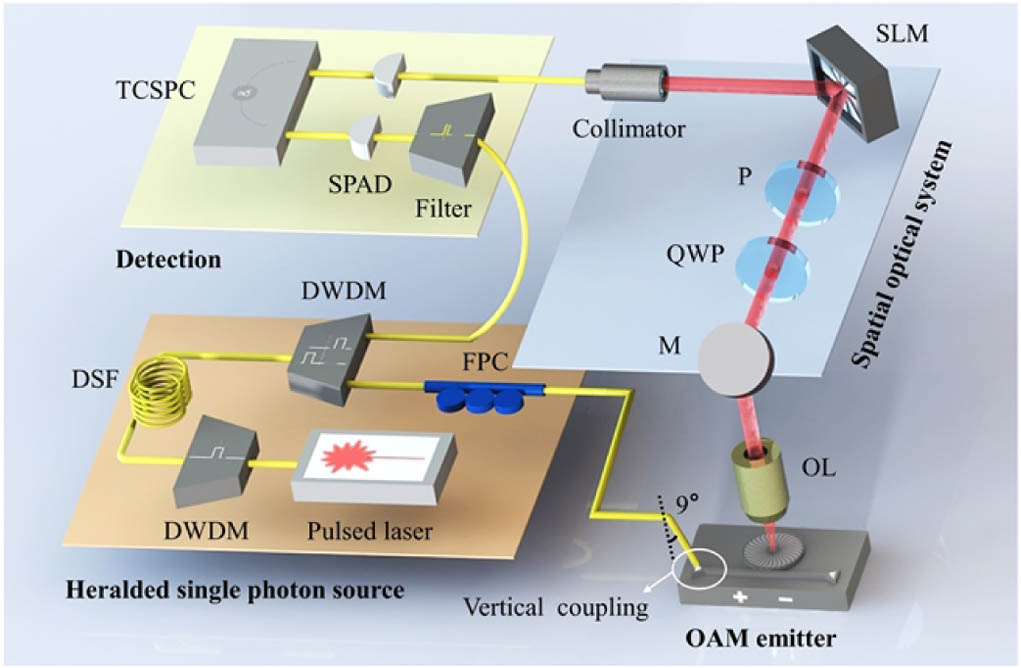
Fig. 1. Experimental scheme consisting of the heralded single-photon source, OAM emitter, spatial optical system, and detector. FPC, fiber polarization controller; OL, objective lens; M, mirror; QWP, quarter-wave plate; P, polarizer.
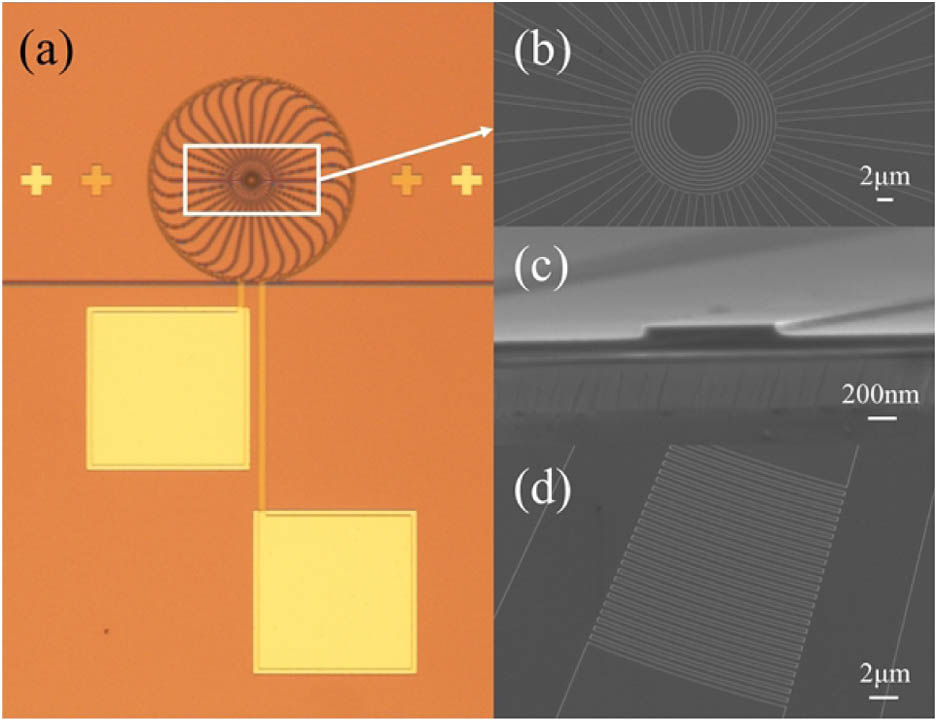
Fig. 2. (a) Microscopic photograph of the OAM emitter; (b) scanning electron microscopy (SEM) image of the concentric scattering grating in the center of the OAM emitter; SEM images of (c) the shallow ridge waveguide and (d) the grating for vertical coupling.
Fig. 3. Experimental setup for measuring the topological charge and mode purity. BS, beam splitter; FBS, fiber beam splitter.
Fig. 4. Interference fringes of Gaussian mode and generated OAM modes of l
Fig. 5. Relation between the topological charges and the electrically driving power (red marks), together with the corresponding driving voltage (blue marks), while the incident wavelength is fixed at 1554.56 nm. The insets are the interference fringes corresponding to each OAM mode of the LHCP state.
Fig. 6. Mode purities of azimuthally polarized OAM modes with l
Fig. 7. (a) Typical coincidence counts of heralded single photons with an OAM mode of l = 5 l = 3 – 7

Set citation alerts for the article
Please enter your email address
© Copyright 2018-2021 | Chinese Laser Press. All Rights Reserved 沪ICP备15018463号-20