Author Affiliations
National Satellite Meteorological Center, China Meteorological Administration, Beijing, 100081, Chinashow less
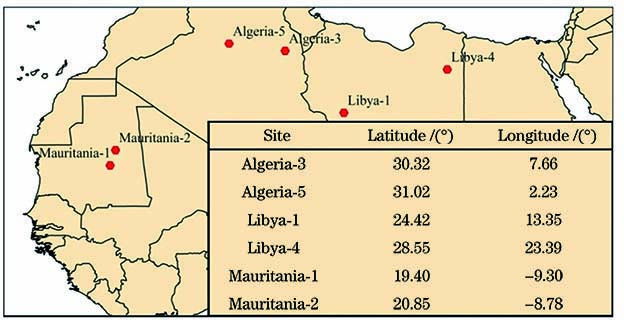
Fig. 1. Distribution of six pseudo-invariant targets
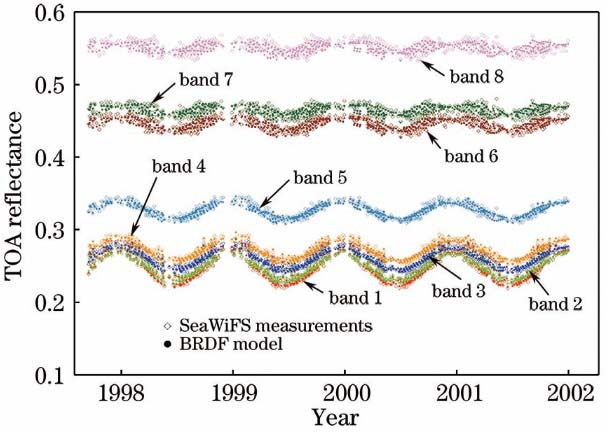
Fig. 2. Time series of TOA reflectance observed by SeaWiFS versus BRDF modeling over Libya-4
Fig. 3. Time series of BRDF modeling errors and statistical factors over Libya-4
Fig. 4. SRF of SeaWiFS and MERSI, as well as simulated TOA spectral radiance for four different scenarios of gaseous absorption over desert
Fig. 5. Mean of the bias between modeled TOA reflectance and MERSI L1 TOA reflectance of the six pseudo-invariant targets (the error bar represents the standard deviation of the bias). (a) Algeria-3; (b) Algeria-5; (c) Libya-1; (d) Libya-4; (e) Mauritania-1; (f) Mauritania-2
Fig. 6. ρTOA time series obtained by calibration
Fig. 7. Time series of monthly mean relative deviation from 2011 to 2015 between cross-calibration reflectance and MERSI L1 calibration data. (a) Algeria-3; (b) Algeria-5; (c) Libya-1; (d) Libya-4; (e) Mauritania-1; (f) Mauritania-2
| Instrument | Band | Central wavelength /μm | Bandwidth /μm | Spatial resolution /m |
|---|
| 8 | 0.412 | 0.02 | 1000 | | 9 | 0.443 | 0.02 | 1000 | | 10 | 0.490 | 0.02 | 1000 | | 11 | 0.520 | 0.02 | 1000 | | MERSI | 12 | 0.565 | 0.02 | 1000 | | 13 | 0.650 | 0.02 | 1000 | | 14 | 0.685 | 0.02 | 1000 | | 15 | 0.765 | 0.02 | 1000 | | 16 | 0.865 | 0.02 | 1000 | | 1 | 0.412 | 0.02 | 4000 | | 2 | 0.443 | 0.02 | 4000 | | 3 | 0.490 | 0.02 | 4000 | | SeaWiFS | 4 | 0.510 | 0.02 | 4000 | | 5 | 0.555 | 0.02 | 4000 | | 6 | 0.670 | 0.02 | 4000 | | 7 | 0.765 | 0.04 | 4000 | | 8 | 0.865 | 0.04 | 4000 |
|
Table 1. Spectral band specifications for MERSI and SeaWiFS
| Band | RMSE of each site /% |
|---|
| Algeria-3 | Algeria-5 | Libya-1 | Libya-4 | Mauritania-1 | Mauritania-2 |
|---|
| Band 1 | 2.014 | 1.907 | 1.952 | 1.201 | 2.501 | 2.730 | | Band 2 | 2.352 | 2.282 | 2.103 | 1.098 | 2.815 | 3.136 | | Band 3 | 2.615 | 2.430 | 2.046 | 1.154 | 2.800 | 3.216 | | Band 4 | 2.324 | 2.187 | 1.881 | 1.109 | 2.537 | 2.935 | | Band 5 | 1.600 | 1.610 | 1.489 | 1.147 | 1.967 | 2.055 | | Band 6 | 0.992 | 1.031 | 0.833 | 0.920 | 1.445 | 1.480 | | Band 7 | 1.003 | 1.021 | 0.840 | 0.912 | 1.365 | 1.379 | | Band 8 | 1.176 | 1.067 | 0.895 | 0.990 | 1.408 | 1.397 |
|
Table 2. RMSE of BRDF fitting for different bands over different sites
| Simulation condition | Content |
|---|
| Surface | Desert | | Aerosol model | Desert | | Solar zenith angle /(°) | 0 to 60(step: 15) | | Viewing zenith angle /(°) | 0 to 60(step: 10) | | Relative azimuth angle /(°) | 0 to 180(step: 36) | | Total water vapor content /(g·cm-2) | 0 to 5.0(step: 1.0) | | Total ozone content /(DU) | 0 to 400(step: 100) |
|
Table 3. Simulation condition of MODTRAN
| Parameter | Band 8 | Band 9 | Band 10 | Band 11 | Band 12 | Band 13 | Band 14 | Band 15 | Band 16 |
|---|
| P1 | 1.704638 | 1.2734834 | 1.084228 | 2.273839 | 2.654799 | 1.286987 | 1.818853 | 1.071687 | 1.076728 | | P2 | -1.0202 | -0.3986542 | -0.12324 | -1.78536 | -2.28282 | -0.24861 | -0.99434 | -0.06433 | -0.07037 | | P3 | 0.575016 | 0.21967103 | 0.069109 | 0.989652 | 1.251265 | 0.127415 | 0.543227 | 0.08658 | 0.057175 | | P4 | -0.14385 | -0.0531473 | -0.01697 | -0.23772 | -0.29688 | -0.02819 | -0.12874 | -0.02126 | -0.00996 | | P5 | 0.013054 | 0.00468685 | 0.001506 | 0.020599 | 0.025414 | 0.002171 | 0.010725 | 0.015286 | 0.038343 | | P6 | -0.0828 | -0.5411471 | -0.21492 | 0.340805 | 1.092247 | 0.015543 | 3.770866 | -0.03278 | -0.02993 | | P7 | 0.08351 | 0.7806828 | 0.308001 | -0.53791 | -1.62312 | -0.0736 | -5.38317 | 0.009528 | 0.005455 | | P8 | -0.04019 | -0.4158658 | -0.16288 | 0.303555 | 0.877055 | 0.055358 | 2.83456 | 0.00017 | -0.0086 | | P9 | 0.005171 | 0.0960645 | 0.037296 | -0.07609 | -0.20681 | -0.01846 | -0.64397 | 0.004814 | 0.006614 | | P10 | -4.8×10⁻⁵ | -0.0081476 | -0.00314 | 0.006858 | 0.017685 | 0.00187 | 0.053729 | -0.00176 | -0.00123 | | P11 | | | | | | | | -0.00024 | 0.000677 | | P12 | | | | | | | | -0.00022 | -0.00052 | | P13 | | | | | | | | 0.000114 | 9.82×10⁻⁵ |
|
Table 4. SBAF model parameters for nine spectral channels
| Band | Bias mean | RMSE /% | Bias max | Bias min |
|---|
| Band 8 | 0.0109 | 1.0427 | 2.5898 | -3.1593 | | Band 9 | 0.0004 | 0.2032 | 0.5175 | -0.5880 | | Band 10 | 0.0001 | 0.1185 | 0.2919 | -0.3660 | | Band 11 | 0.0053 | 0.7315 | 2.3717 | -2.0748 | | Band 12 | 0.0063 | 0.8013 | 2.8750 | -2.5399 | | Band 13 | 0.0206 | 1.4304 | 4.6135 | -4.7072 | | Band 14 | 0.0194 | 1.3905 | 5.6749 | -5.3018 | | Band 15 | 0.0076 | 0.8846 | 8.7129 | -2.3706 | | Band 16 | 0.0011 | 0.3377 | 2.4990 | -0.9414 |
|
Table 5. Bias between parameterized and simulated SBAFs
| Band | k0 | k1 |
|---|
| Band 8 | -1.7816 | 0.02002 | | Band 9 | -2.5908 | 0.02008 | | Band 10 | -2.7469 | 0.0202 | | Band 11 | -1.9051 | 0.02005 | | Band 12 | -3.2241 | 0.02015 | | Band 13 | -2.0301 | 0.0203 | | Band 14 | -2.4053 | 0.02021 | | Band 15 | -2.0037 | 0.02024 | | Band 16 | -2.4507 | 0.02042 |
|
Table 6. FY-3B MERSI calibration coefficient