• Photonics Research
  • Vol. 11, Issue 4, 582 (2023)
Pierre Didier1、2、*, Hedwig Knötig3, Olivier Spitz1、4, Laurent Cerutti5, Anna Lardschneider2, Elie Awwad1, Daniel Diaz-Thomas5, A. N. Baranov5, Robert Weih6, Johannes Koeth6, Benedikt Schwarz3, and Frédéric Grillot1、7
Author Affiliations
  • 1LTCI Télécom Paris, Institut Polytechnique de Paris, Palaiseau 91120, France
  • 2mirSense, Centre d’intégration NanoInnov, Palaiseau 91120, France
  • 3Institute for Solid State Electronics, TU Wien, 1040 Vienna, Austria
  • 4Currently with CREOL, College of Optics and Photonics, University of Central Florida, Orlando, Florida 32816, USA
  • 5Institut d’Electronique et des Systèmes, Université de Montpellier, CNRS UMR 5214, Montpellier 34000, France
  • 6Nanoplus Nanosystems and Technologies GmbH, 97218 Gerbrunn, Germany
  • 7Center for High Technology Materials, University of New Mexico, Albuquerque, New Mexico 87106, USA
  • show less
    DOI: 10.1364/PRJ.478776 Cite this Article Set citation alerts
    Pierre Didier, Hedwig Knötig, Olivier Spitz, Laurent Cerutti, Anna Lardschneider, Elie Awwad, Daniel Diaz-Thomas, A. N. Baranov, Robert Weih, Johannes Koeth, Benedikt Schwarz, Frédéric Grillot. Interband cascade technology for energy-efficient mid-infrared free-space communication[J]. Photonics Research, 2023, 11(4): 582 Copy Citation Text show less
    Characteristics of cascaded interband devices. (a) Calculated band alignment and probability density functions of one stage of the ICL active region for an internal electric field of 80 kV/cm and emission at 4.18 μm [45]. (b) Schematic representation of the band alignment and SEM picture of the heterostructure of the ICIP detector. (c) Measured responsivity of the ICIP under zero bias operation at room temperature (yellow curve) together with the normalized emission spectrum of the ICL at a temperature of 20°C and a drive current of 100 mA (red curve). The detector is well suited for the emission wavelength of the source around 4.18 μm. The inset displays more precisely the emission spectrum of the ICL showing the multimode emission composed by two lobes located left and right of 4.18 μm. (d) Dark current density characterization for four different mesa sizes from 25 μm to 100 μm. With a 4.5 V bias and at 20°C, the 75 μm ICIP shows a dark current of 1.6 mA. When illuminated by the 5 mW ICL beam, the photocurrent is around 2.3 mA.
    Fig. 1. Characteristics of cascaded interband devices. (a) Calculated band alignment and probability density functions of one stage of the ICL active region for an internal electric field of 80 kV/cm and emission at 4.18 μm [45]. (b) Schematic representation of the band alignment and SEM picture of the heterostructure of the ICIP detector. (c) Measured responsivity of the ICIP under zero bias operation at room temperature (yellow curve) together with the normalized emission spectrum of the ICL at a temperature of 20°C and a drive current of 100 mA (red curve). The detector is well suited for the emission wavelength of the source around 4.18 μm. The inset displays more precisely the emission spectrum of the ICL showing the multimode emission composed by two lobes located left and right of 4.18 μm. (d) Dark current density characterization for four different mesa sizes from 25 μm to 100 μm. With a 4.5 V bias and at 20°C, the 75 μm ICIP shows a dark current of 1.6 mA. When illuminated by the 5 mW ICL beam, the photocurrent is around 2.3 mA.
    (a) Experimental setup for the high-speed transmission in the mid-infrared domain with interband cascade devices. At the optimized working condition, the 4.18 μm ICL emits around 5 mW of optical power. We modulate our laser with a 10 dB amplified signal produced by an AWG. The ICIP detects the modulated optical wave and converts it to an electrical signal, which is subsequently fed to a high-speed oscilloscope and then analyzed. Pictures of the devices of interest are shown in insets 1 and 2. The RF-optimized ICL can be seen on the left with its contacts connected to a coplanar waveguide and a 2.92 mm RF-launcher. On the right, the ICIP can be visualized. Short wire bonds are used to connect the contacts to a coplanar waveguide that is attached to an end-launch connector as well. (b) Frequency response of the IC communication system at a pump current of 140 mA for the ICL and with the ICIP biased at, respectively, 0, 2, 4.5, and 5 V. The gray curve represents the noise level in the same configuration when the ICL beam is blocked. For comparison, the frequency response of the system using a 20 GHz 3 dB bandwidth QCD for detection is shown in Appendix C. (c) Time response of the full system recorded by the oscilloscope for a 10 Gbit/s transmission after post-processing (in red) compared to the generated PRBS message (in green). It shows the high-frequency limitation of the system when there is a repeated alternate sequence of “0”-bit and “1”-bit. For the message sequence shown here, the BER is as low as 0.025%.
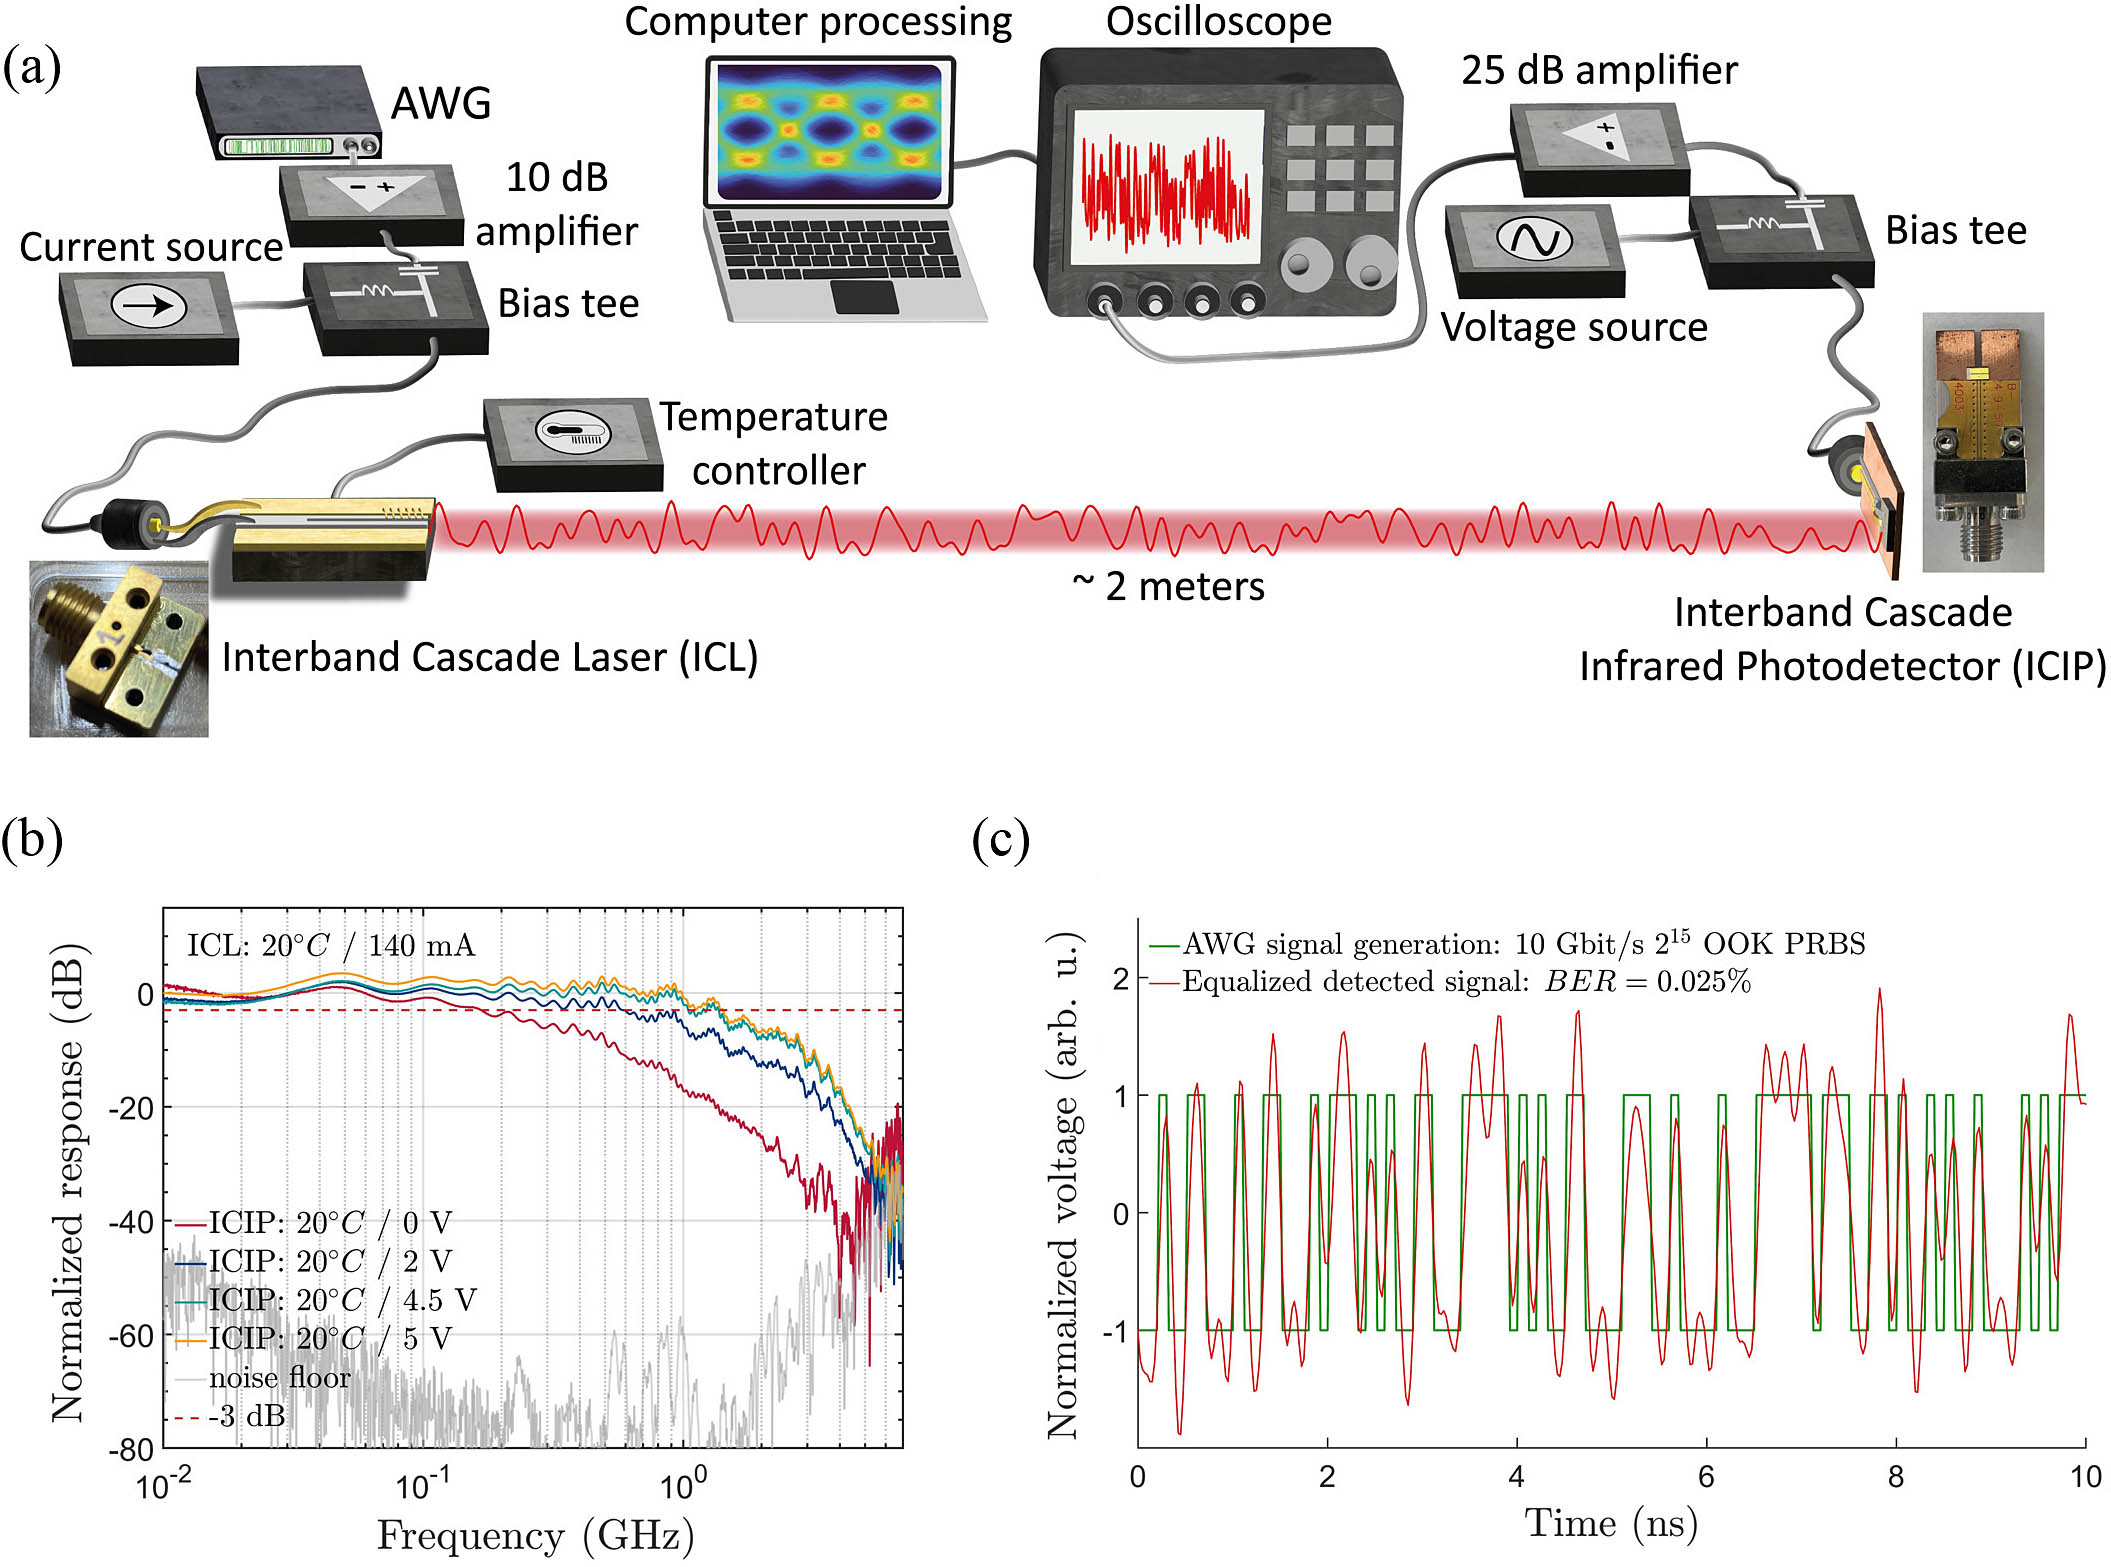
    Fig. 2. (a) Experimental setup for the high-speed transmission in the mid-infrared domain with interband cascade devices. At the optimized working condition, the 4.18 μm ICL emits around 5 mW of optical power. We modulate our laser with a 10 dB amplified signal produced by an AWG. The ICIP detects the modulated optical wave and converts it to an electrical signal, which is subsequently fed to a high-speed oscilloscope and then analyzed. Pictures of the devices of interest are shown in insets 1 and 2. The RF-optimized ICL can be seen on the left with its contacts connected to a coplanar waveguide and a 2.92 mm RF-launcher. On the right, the ICIP can be visualized. Short wire bonds are used to connect the contacts to a coplanar waveguide that is attached to an end-launch connector as well. (b) Frequency response of the IC communication system at a pump current of 140 mA for the ICL and with the ICIP biased at, respectively, 0, 2, 4.5, and 5 V. The gray curve represents the noise level in the same configuration when the ICL beam is blocked. For comparison, the frequency response of the system using a 20 GHz 3 dB bandwidth QCD for detection is shown in Appendix C. (c) Time response of the full system recorded by the oscilloscope for a 10 Gbit/s transmission after post-processing (in red) compared to the generated PRBS message (in green). It shows the high-frequency limitation of the system when there is a repeated alternate sequence of “0”-bit and “1”-bit. For the message sequence shown here, the BER is as low as 0.025%.
    Eye diagrams of the transmission after a free-space propagation of approximately 2 m for two different modulation formats. An eye diagram represents the overlapping of the recorded signal at a fixed time interval corresponding to an integer multiple of the bit time-length. This tool allows a qualitative analysis of the transmission performance, as an open eye is equivalent to a low error rate because it shows the ability to distinguish the different levels of modulation. (a) OOK format at 12 Gbit/s exhibiting an error rate of 0.22%. (c) PAM-4 format at 14 Gbit/s with an error rate of 0.23%. (b) and (d) show the optimization parameters of FFE equalization in order to achieve the lowest BER. In both cases, there is a particular set of parameters where the equalization allows one to highly optimize the quality of the transmission.
    Fig. 3. Eye diagrams of the transmission after a free-space propagation of approximately 2 m for two different modulation formats. An eye diagram represents the overlapping of the recorded signal at a fixed time interval corresponding to an integer multiple of the bit time-length. This tool allows a qualitative analysis of the transmission performance, as an open eye is equivalent to a low error rate because it shows the ability to distinguish the different levels of modulation. (a) OOK format at 12 Gbit/s exhibiting an error rate of 0.22%. (c) PAM-4 format at 14 Gbit/s with an error rate of 0.23%. (b) and (d) show the optimization parameters of FFE equalization in order to achieve the lowest BER. In both cases, there is a particular set of parameters where the equalization allows one to highly optimize the quality of the transmission.
    (a) Eye diagram of the transmission after a free-space propagation of around 2 m for the PAM-8 format at 15 Gbit/s, exhibiting an error rate of 1.9%. (b) Optimization of the FFE equalization parameters in order to achieve the lowest BER.
    Fig. 4. (a) Eye diagram of the transmission after a free-space propagation of around 2 m for the PAM-8 format at 15 Gbit/s, exhibiting an error rate of 1.9%. (b) Optimization of the FFE equalization parameters in order to achieve the lowest BER.
    Evolution of the equalized signal’s BER as a function of the data rate for different modulation formats. The dashed lines depict BER limits for 7% HD-FEC (gray) and 27% HD-FEC (cyan), respectively.
    Fig. 5. Evolution of the equalized signal’s BER as a function of the data rate for different modulation formats. The dashed lines depict BER limits for 7% HD-FEC (gray) and 27% HD-FEC (cyan), respectively.
    Eye diagrams of the transmission after a free-space propagation of approximately 2 m for two different modulation formats. (a) OOK format at 14 Gbit/s exhibiting an error rate of 1.8%. (b) PAM-4 format at 16 Gbit/s with an error rate of 1.6%.
    Fig. 6. Eye diagrams of the transmission after a free-space propagation of approximately 2 m for two different modulation formats. (a) OOK format at 14 Gbit/s exhibiting an error rate of 1.8%. (b) PAM-4 format at 16 Gbit/s with an error rate of 1.6%.
    Frequency response of the system when using a 20 GHz 3 dB bandwidth QCD for detection to replace the ICIP. The whole system now has a 3 dB bandwidth of 2.5 GHz, showing that the full interband configuration with ICL and ICIP is limited by the response of the ICIP.
    Fig. 7. Frequency response of the system when using a 20 GHz 3 dB bandwidth QCD for detection to replace the ICIP. The whole system now has a 3 dB bandwidth of 2.5 GHz, showing that the full interband configuration with ICL and ICIP is limited by the response of the ICIP.
    Pierre Didier, Hedwig Knötig, Olivier Spitz, Laurent Cerutti, Anna Lardschneider, Elie Awwad, Daniel Diaz-Thomas, A. N. Baranov, Robert Weih, Johannes Koeth, Benedikt Schwarz, Frédéric Grillot. Interband cascade technology for energy-efficient mid-infrared free-space communication[J]. Photonics Research, 2023, 11(4): 582
    Download Citation