
Zejun Wu, Lisen Yang. Observation Method of Slight Changes of Light Induced Refractive Index[J]. Laser & Optoelectronics Progress, 2018, 55(6): 061902
- Laser & Optoelectronics Progress
- Vol. 55, Issue 6, 061902 (2018)
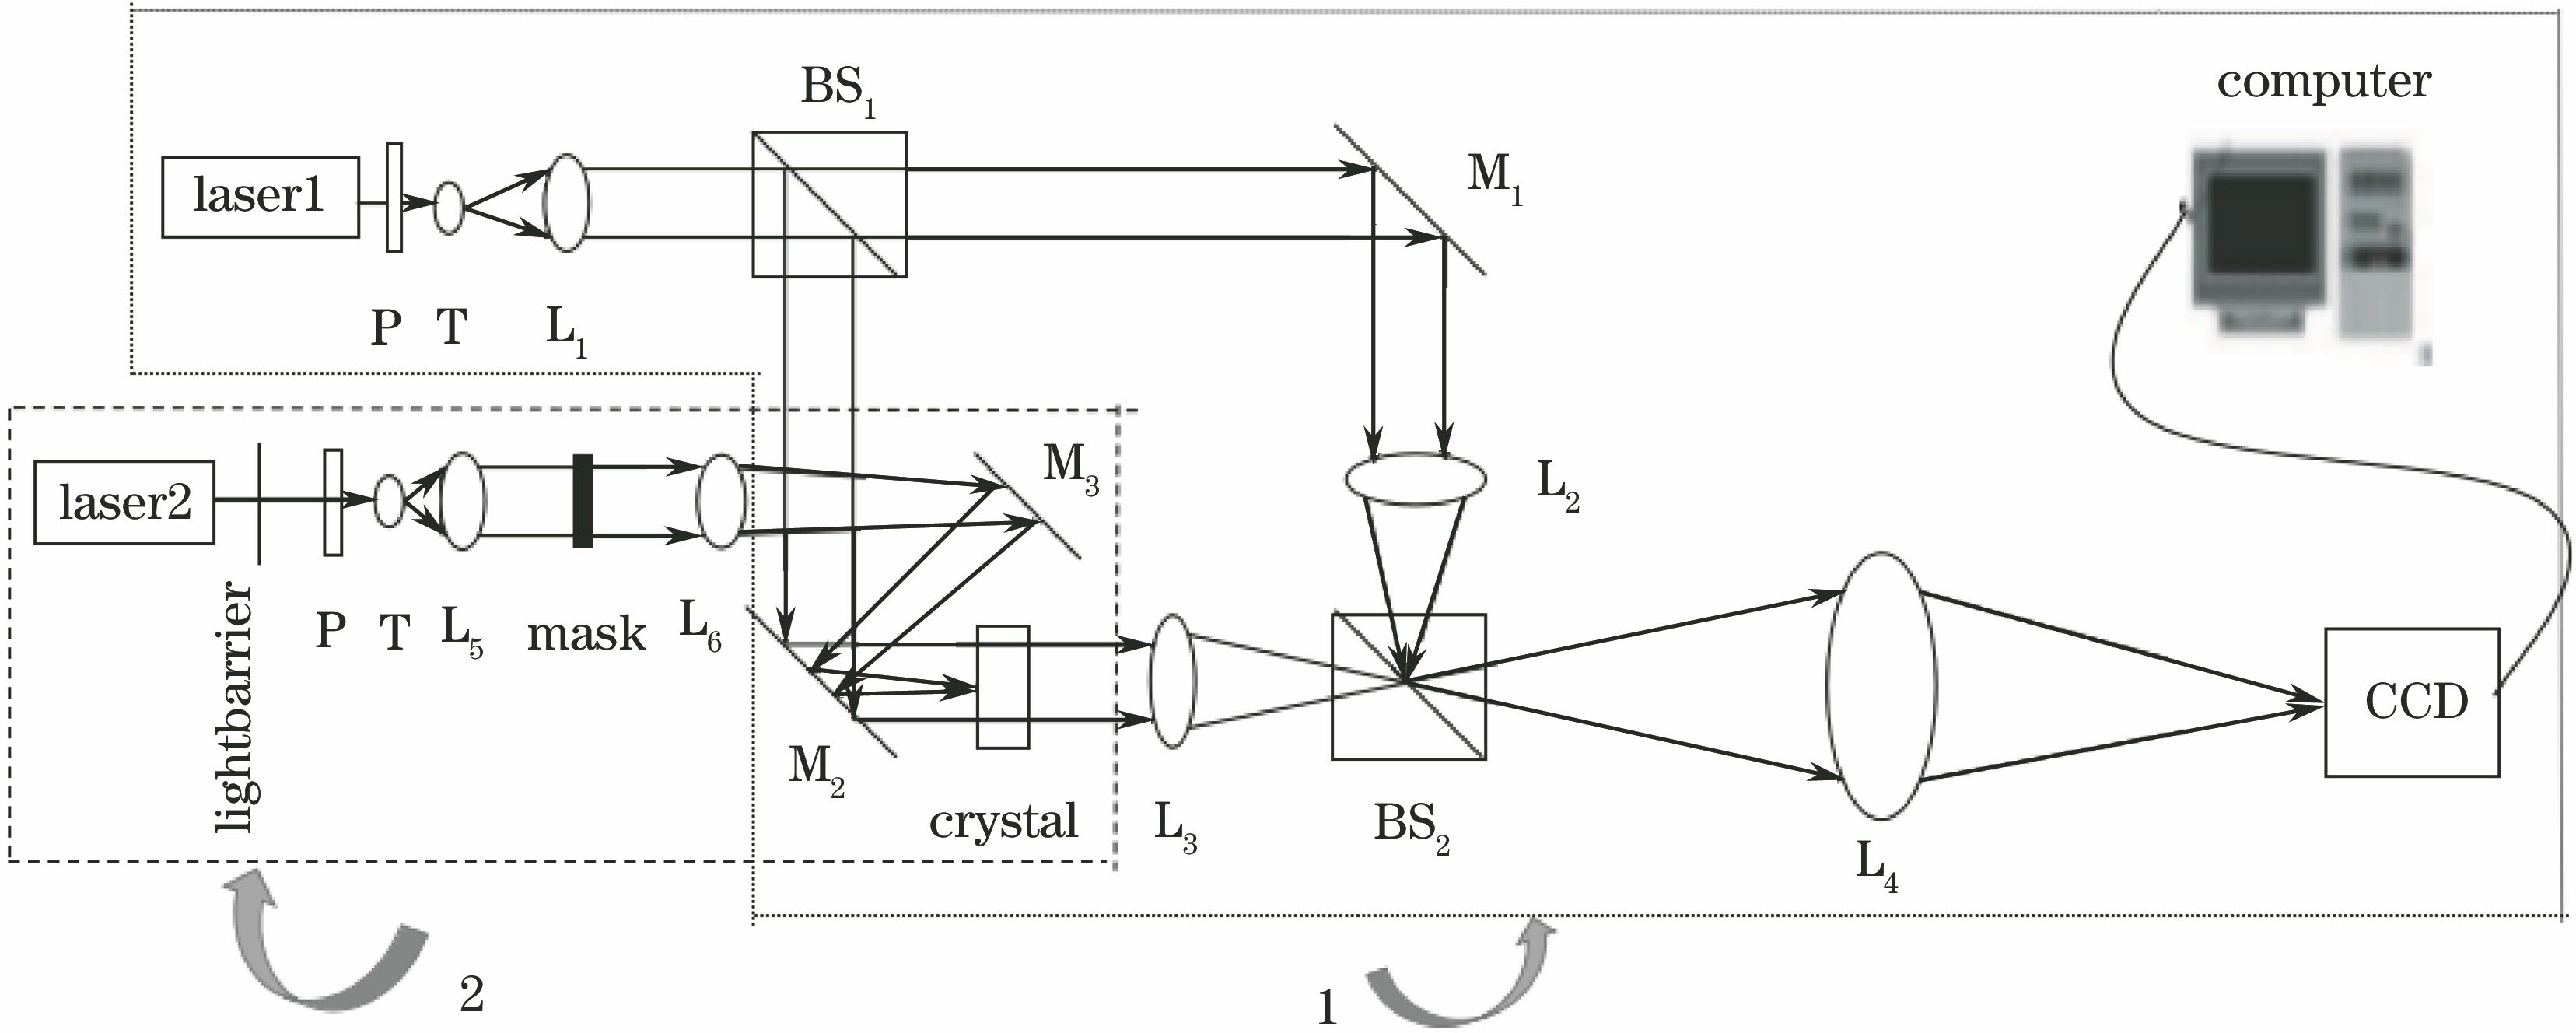
Fig. 1. Real time observation optical path
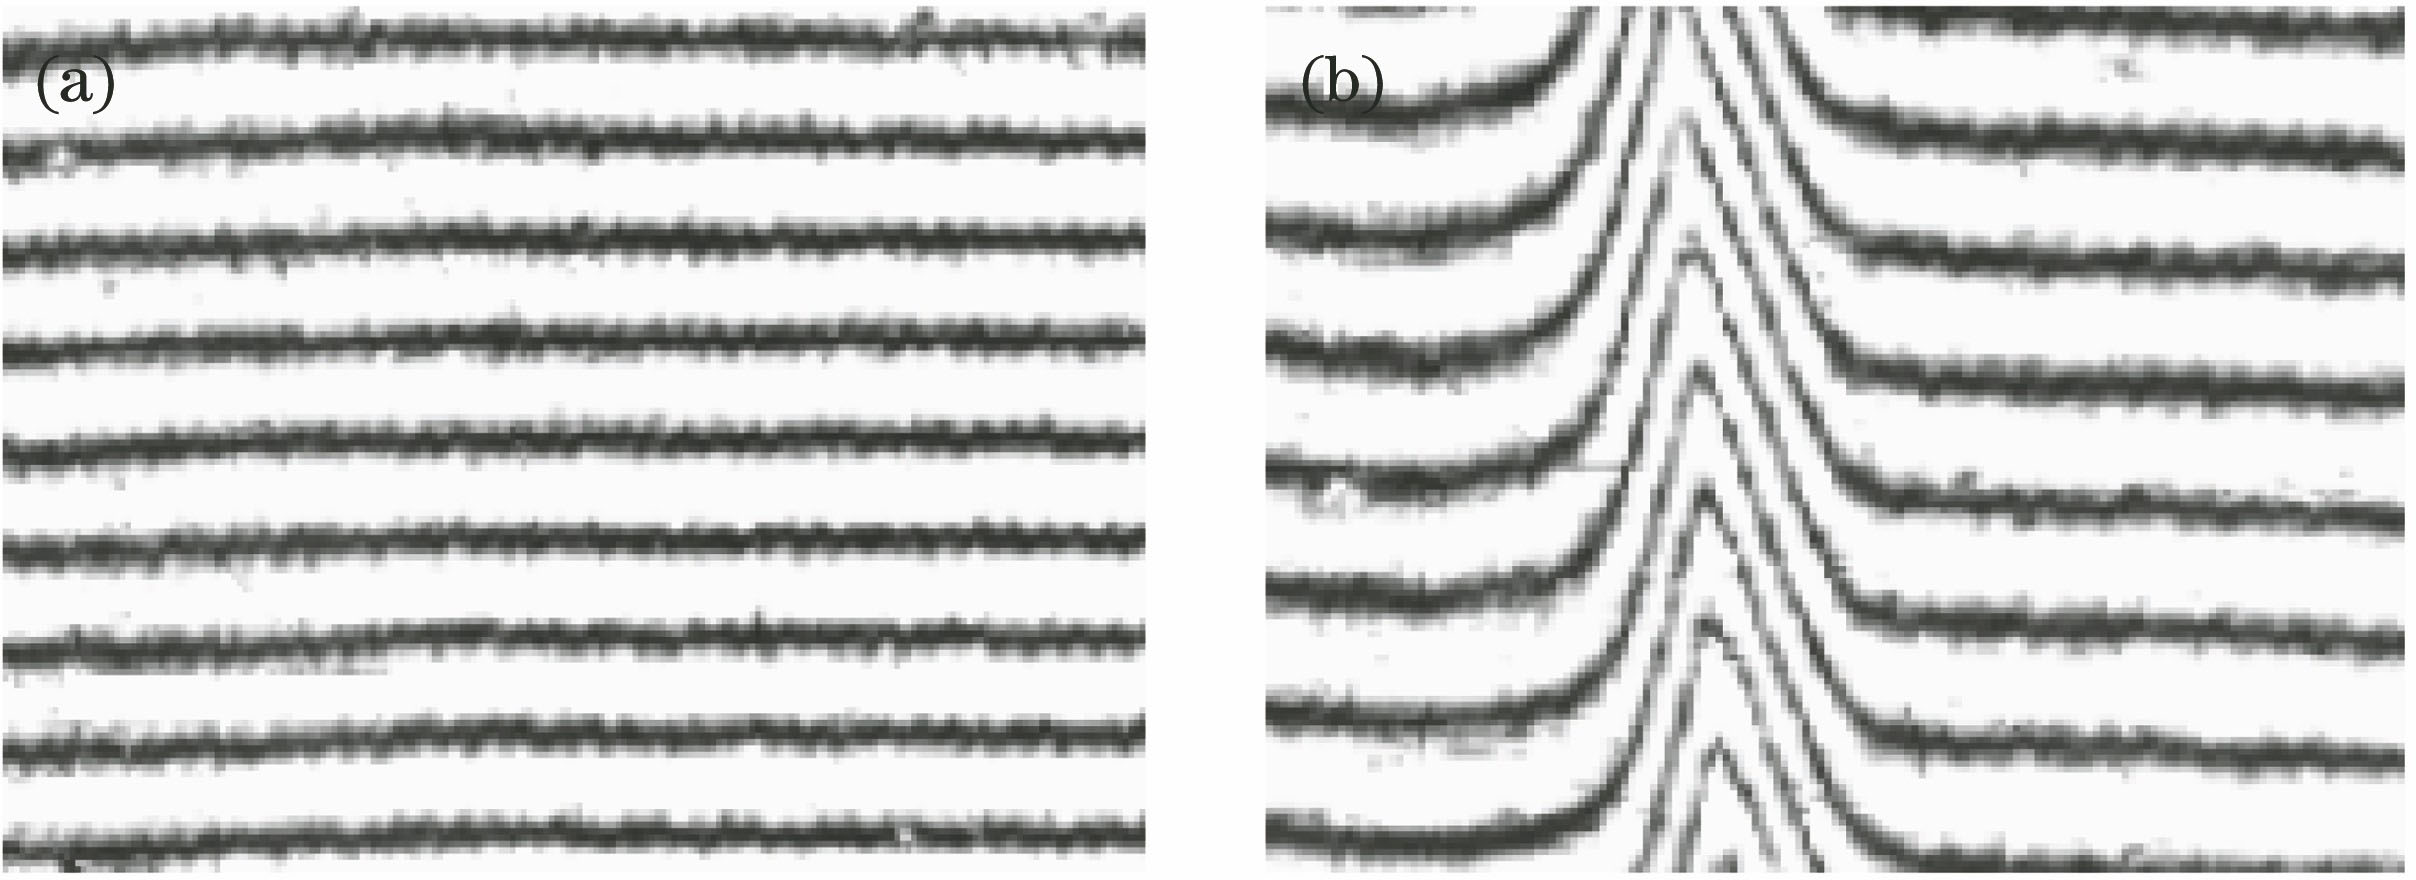
Fig. 2. (a) Interference stripe and (b) fringe swing diagram
Fig. 3. (a)Swing diagram and (b) waveguide diagram of multiple stripes
Fig. 4. Fourier transform diagram
Fig. 5. (a-c) Contrast diagrams and (d) waveguide diagram of lithium niobate crystal fringes under the same conditions when the maximum wobble of lithium niobate crystals is reached. (a) Red light, 90 min; (b) green light, 60 min; (c) blue light, 50 min; (d) waveguide
Fig. 6. Optical path diagram of high density photonic lattice
Fig. 7. (a-c) Refractive index variations at different intervals and (d-f) corresponding waveguide diagrams

Set citation alerts for the article
Please enter your email address
© Copyright 2018-2021 | Chinese Laser Press. All Rights Reserved 沪ICP备15018463号-20