
Yuzhen Liu, Zhengquan Jiang, Fei Ma, Chunhua Zhang. Hyperspectral Image Classification Based on Hypergraph and Convolutional Neural Network[J]. Laser & Optoelectronics Progress, 2019, 56(11): 111007
- Laser & Optoelectronics Progress
- Vol. 56, Issue 11, 111007 (2019)
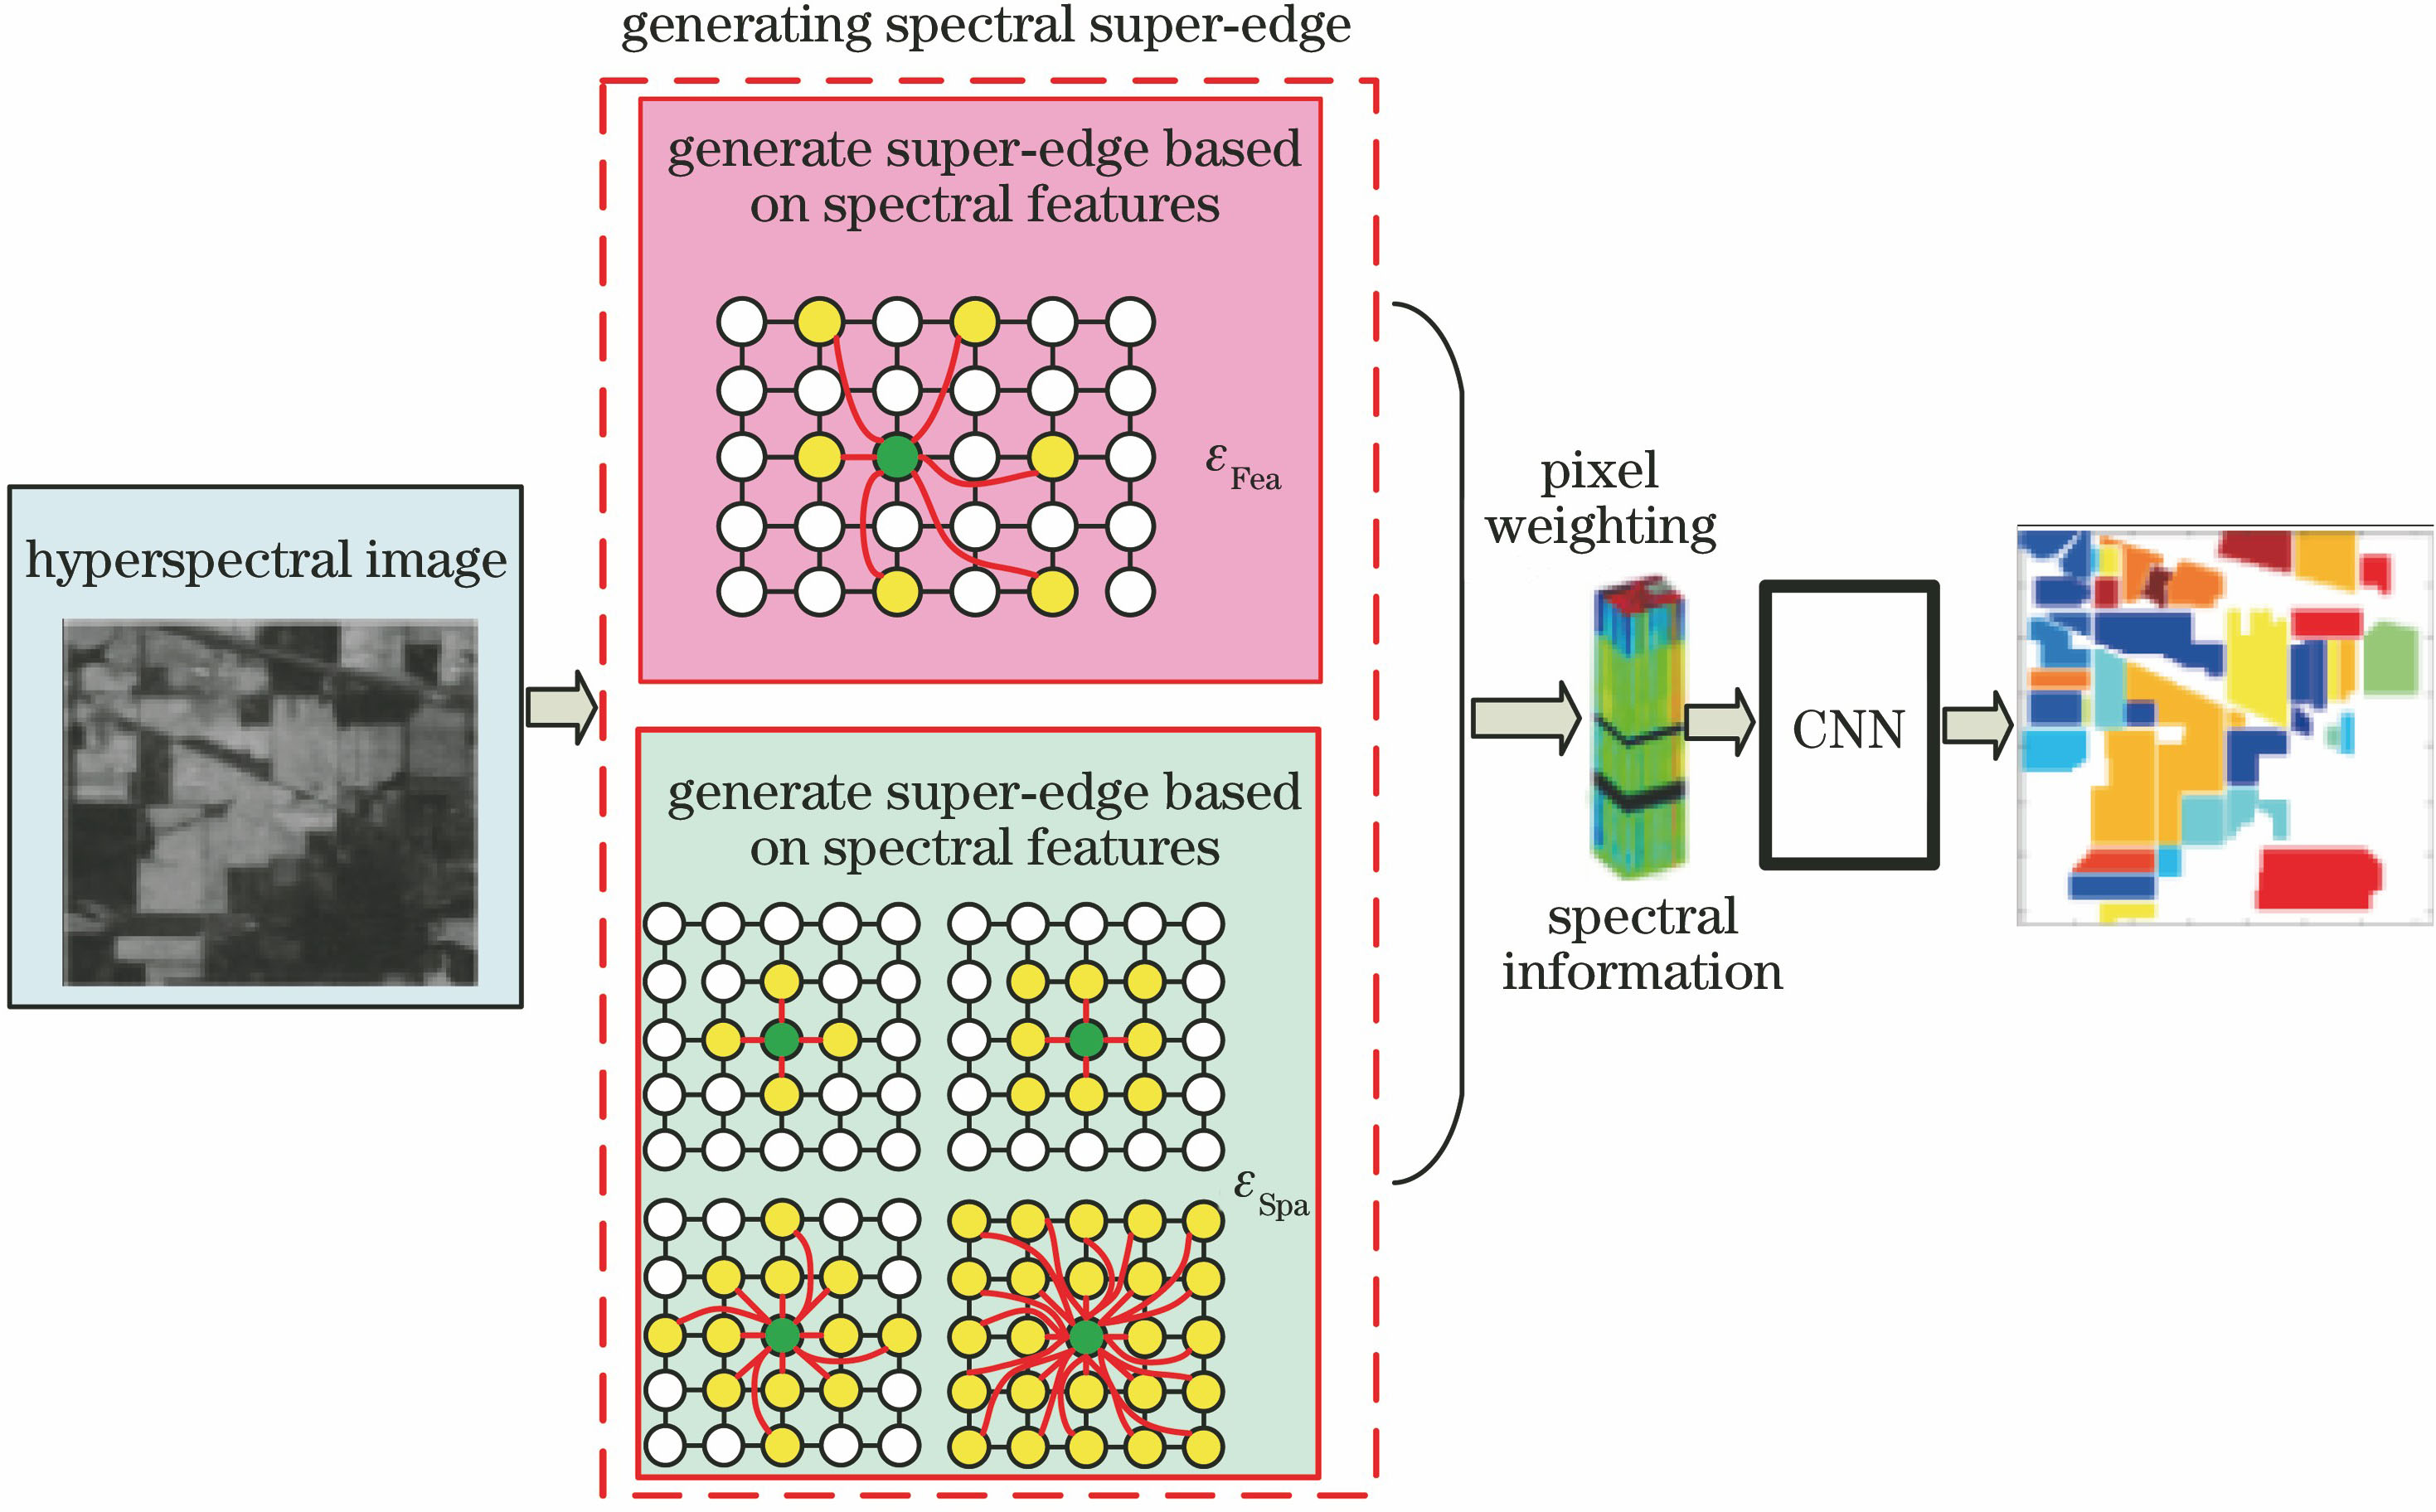
Fig. 1. Schematic of G-CNN classification model
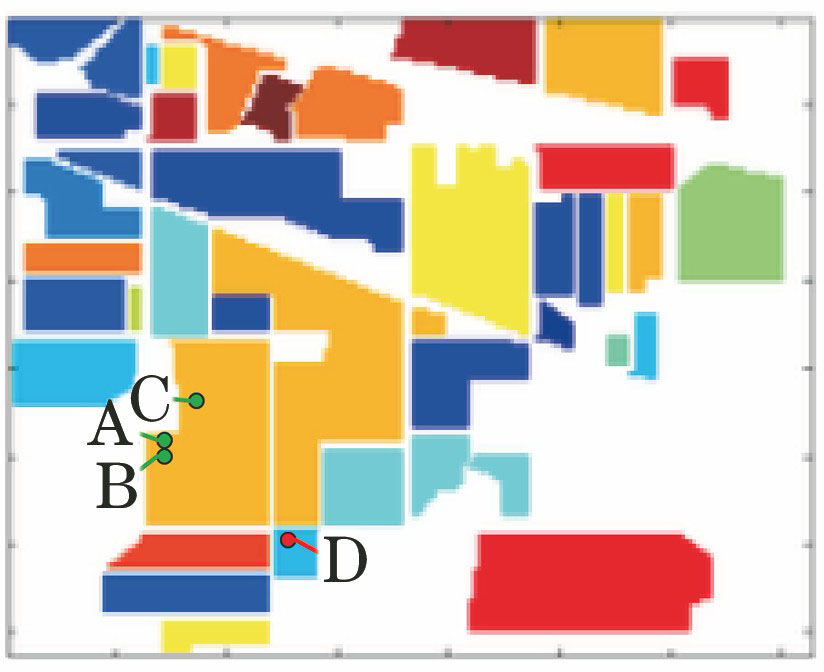
Fig. 2. Relationship between spectral and spatial information of hyperspectral images
Fig. 3. Super-edge construction based on spectral features
Fig. 4. Hypergraph construction of spatial relationship. (a) 4 neighborhood; (b) 8 neighborhood; (c) 16 neighborhood; (d) 24 neighborhood
Fig. 5. Schematic of CNN classification model
Fig. 6. Effect of number of training samples on accuracy of algorithm
Fig. 7. Influence of experimental parameter change on experimental precision. (a) P; (b) U; (c) δ
Fig. 8. Classification results by different algorithms on Indian Pines dataset. (a) Ground-truth; (b) SVM; (c) G-SVM; (d) Shallower CNN; (e) Contextual Deep CNN; (f) SPPF CNN; (g) G-CNN; (h) label
| ||||||||||||||||||||||||||||||||||||||||
Table 1. Number of training samples and test samples in Indian Pines dataset
|
Table 2. Parameter setting of convolutional neural network
|
Table 3. Training time and test time for each algorithm on Indian Pines datasets
|
Table 4. Overall classification accuracy of each model on three datasets%
|
Table 5. G-CNN classification results%

Set citation alerts for the article
Please enter your email address
© Copyright 2018-2021 | Chinese Laser Press. All Rights Reserved 沪ICP备15018463号-20