• Infrared and Laser Engineering
  • Vol. 50, Issue 8, 20200371 (2021)
Kai Zhou1、2, Daojing Li1、*, Yefei Wang3, Yuan Yao3, and Ming Qiao1
Author Affiliations
  • 1National Key Laboratory of Microwave Imaging Technology, Aerospace Information Research Institute, Chinese Academy of Sciences, Beijing 100190, China
  • 2University of Chinese Academy of Sciences, Beijing 100049, China
  • 3Changchun Institute of Optics, Fine Mechanics and Physics, Chinese Academy of Sciences, Changchun 130033, China
  • show less
    DOI: 10.3788/IRLA20200371 Cite this Article
    Kai Zhou, Daojing Li, Yefei Wang, Yuan Yao, Ming Qiao. Target detection performance of infrared spectrum with diffractive optical system[J]. Infrared and Laser Engineering, 2021, 50(8): 20200371 Copy Citation Text show less
    Optical path diagram of infrared camera system based on diffractive optical system
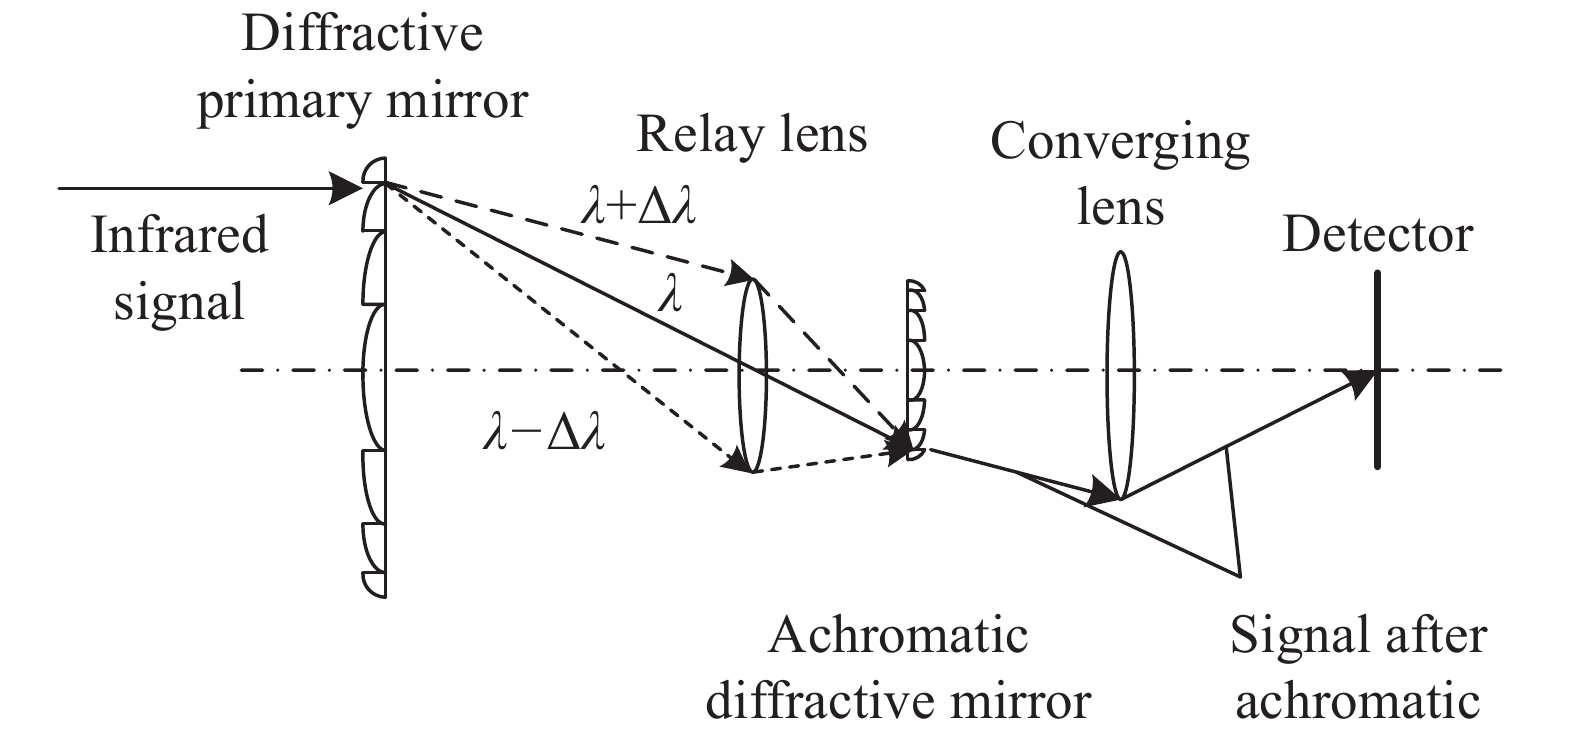
    Fig. 1. Optical path diagram of infrared camera system based on diffractive optical system
    Graph of relative radiant exitance function of black-body when takes different ranges. (a) takes entire range; (b) takes 2.4×10³-3.6×103μm·K ; (c) takes 0-1.5×103μm·K取不同范围时黑体相对辐出度函数图。(a) 取全部范围;(b) 取2.4×10³~3.6×103μm·K;(c) 取
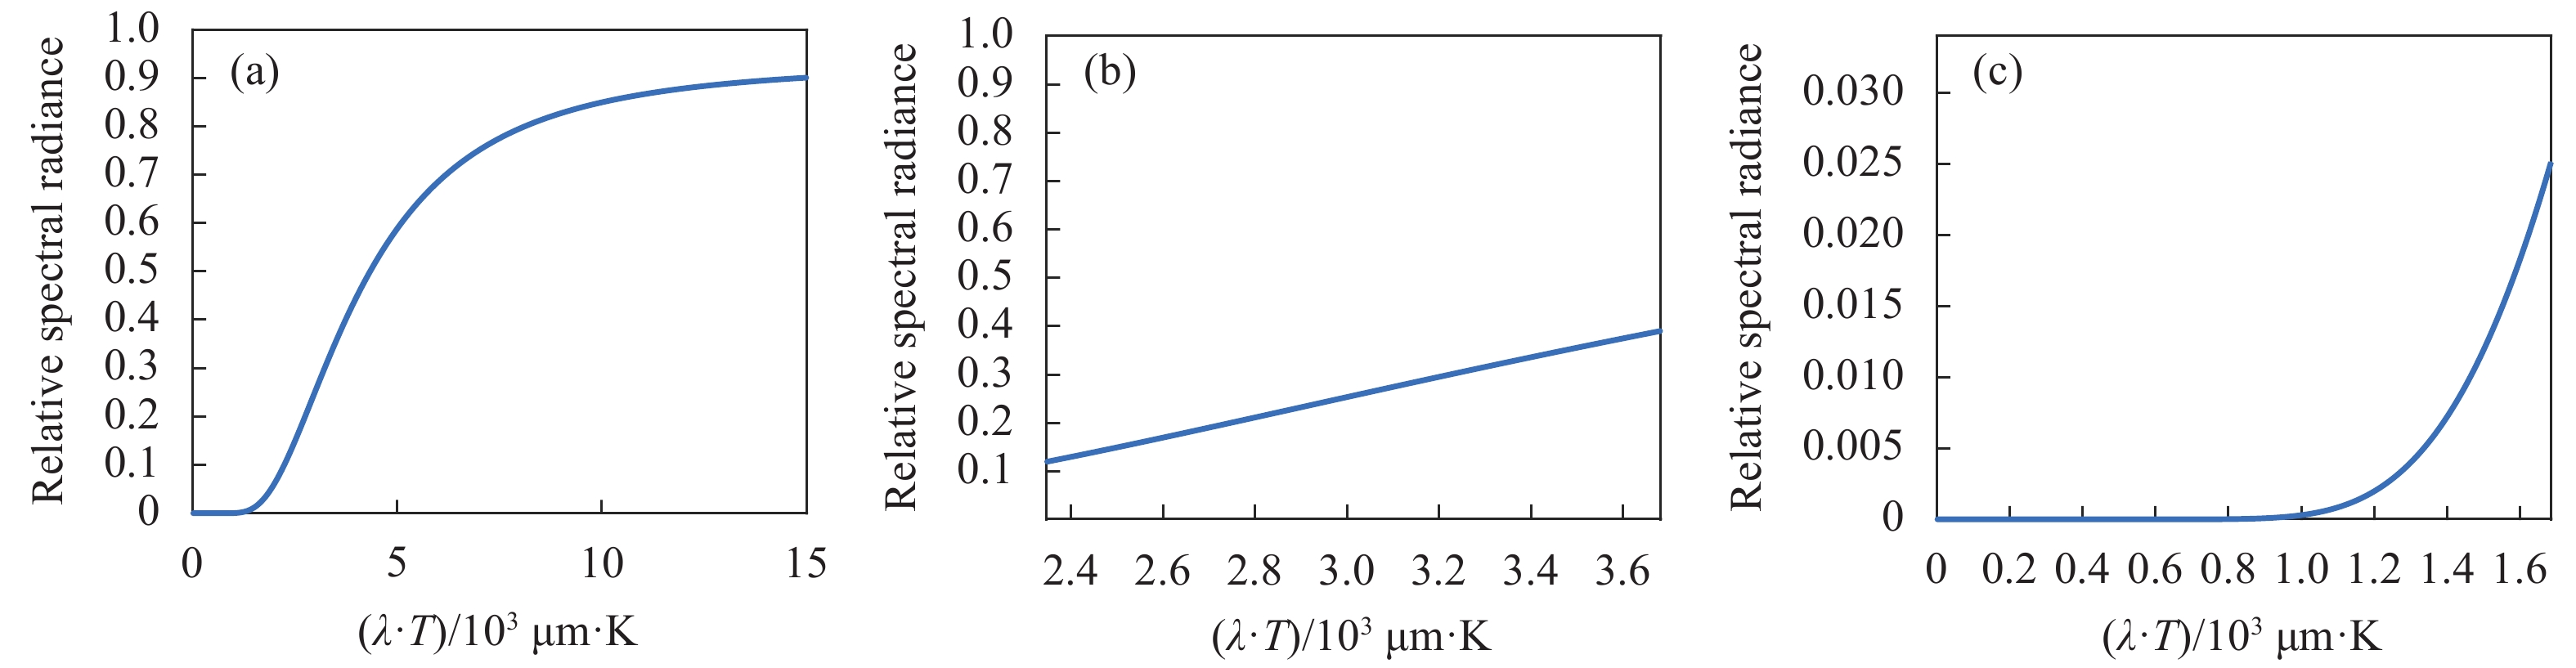
    Fig. 2. Graph of relative radiant exitance function of black-body when takes different ranges. (a) takes entire range; (b) takes 2.4×10³-3.6×103μm·K ; (c) takes 0-1.5×103μm·K 取不同范围时黑体相对辐出度函数图。(a) 取全部范围;(b) 取2.4×10³~3.6×103μm·K;(c) 取
    Same spectral curve of radiance at target/background temperature difference of 1 K
    Fig. 3. Same spectral curve of radiance at target/background temperature difference of 1 K
    Differrent spectral curve of radiance at target background temperature difference of 1 K
    Fig. 4. Differrent spectral curve of radiance at target background temperature difference of 1 K
    Principle block diagram of the laser local oscillator unit detector
    Fig. 5. Principle block diagram of the laser local oscillator unit detector
    ParametersValueParametersValue
    Conversion factor $K$0.7F number of optical systems 1
    Grass background temperature in Summer ${T_B}$303 KDetector peak wavelength ${\lambda _p}$$10.8\;{\text{μm}}$
    First radiation constant ${c_1}$$3.741\;5 \times {10^8}\;{\rm{W}} \cdot \;{{\text{μm}}^4} \cdot \;{{\rm{m}}^2}$Second radiation constant ${c_2}$$1.438\;8 \times {10^4}{\text{μm}} \cdot \;{\rm{K}}$
    Optical system transmittance during testing ${\eta _{0t}}$0.6Background emissivity0.93
    Noise equivalent temperature difference $NETD$$40 \times {10^{ - 3}}\;{\rm{K}}$Integration time during testing ${t_{{\rm{int}} 1}}$$34.56 \times {10^{ - 6}}\;{\rm{s}}$
    Detector pixel area ${A_d}$${\left( {14 \times {{10}^{ - 6}}} \right)^2} \times {10^4}\;{\rm{c}}{{\rm{m}}^2}$Detector specific detectivity ${D^*}$$5.{\rm{4}} \times {10^{10}}\;{\rm{cm}} \cdot \;{\rm{H}}{{\rm{z}}^{1/2}} \cdot \;{{\rm{W}}^{ - 1}}$
    Table 1. Relevant parameters for calculating \begin{document}${D^*}$\end{document}
    ParametersValueParametersValue
    Signal extraction factor $\delta $0.707Number of pixels occupied by the vehicle target on the focal plane ${N_t}$1
    Atmospheric transmittance ${\tau _a}$0.75Optical system aperture ${D_0}$100 mm
    Optical system transmittance ${\eta _0}$0.6Optical system entrance pupil area ${A_0}$$79 \times {10^{ - 4}}\;{{\rm{m}}^2}$
    Integration time in actual work ${t_{{\rm{int}} 2}}$$10 \times {10^{ - 3}}\;{\rm{s}}$Target effective radiation area ${A_t}$$4 \times {10^4}\;{\rm{c}}{{\rm{m}}^2}$
    Background surface temperature303 KTarget surface temperature304/306/308 K
    Detection range R15 kmDetector specific detectivity ${D^*}$$1.4 \times {10^9}\;{\rm{cm} } \cdot \;{\rm{H} }{ {\rm{z} }^{1/2} } \cdot \;{ {\rm{W} }^{ - 1} }$
    Table 2. System parameters
    ParametersValue
    Target/background emissivity0.93/0.93
    Target/background spectral range8-12 μm
    Target radiance$\left( {3.82/3.94/4.06} \right) \times {\rm{1}}{{\rm{0}}^{{\rm{ - 3}}}}\;{\rm{W}} \cdot {\rm{c}}{{\rm{m}}^{ - 2}} \cdot {\rm{s}}{{\rm{r}}^{ - 1}}$
    Background radiance$3.75 \times {\rm{1}}{{\rm{0}}^{{\rm{ - 3}}}}\;{\rm{W}} \cdot {\rm{c}}{{\rm{m}}^{ - 2}} \cdot {\rm{s}}{{\rm{r}}^{ - 1}}$
    SNR of infrared detection with traditional optical system3.9/11.9/20
    SNR of infrared detection with diffractive optical system0.19/0.55/0.92
    Table 3. Infrared detection SNR under different optical systems when the spectral characteristics of target/ background are same
    ParametersValue
    Target/background emissivity0.93/0.2
    Target/background spectral range10.4-11 μm/8-12 μm
    Target radiance$\left( {5.75/5.92/6.1} \right) \times {\rm{1}}{{\rm{0}}^{{\rm{ - 4}}}}\;{\rm{W}} \cdot {\rm{c}}{{\rm{m}}^{ - 2}} \cdot {\rm{s}}{{\rm{r}}^{ - 1}}$
    Background radiance$8.08 \times {\rm{1}}{{\rm{0}}^{{\rm{ - 4}}}}\;{\rm{W}} \cdot {\rm{c}}{{\rm{m}}^{ - 2}} \cdot {\rm{s}}{{\rm{r}}^{ - 1}}$
    SNR of infrared detection with traditional optical system15.2/14/12.9
    SNR of infrared detection with diffractive optical system9.7/10.1/10.5
    Table 4. Infrared detection SNR under different optical systems when the spectral characteristics of target/background are different
    Signal time widthEquivalent noise power
    Electronics system0.25 ns$1.6 \times {10^{ - 11}}\;{\rm{W}}$
    Laser system0.25 ns$7.3 \times {10^{ - 11}}\;{\rm{W}}$
    10 ms$1.8 \times {10^{ - 16}}\;{\rm{W}}$
    Infrared system10 ms$6.8 \times {10^{ - 12}}\;{\rm{W}}$
    Table 5. Equivalent noise power in different systems
    Kai Zhou, Daojing Li, Yefei Wang, Yuan Yao, Ming Qiao. Target detection performance of infrared spectrum with diffractive optical system[J]. Infrared and Laser Engineering, 2021, 50(8): 20200371
    Download Citation