
J. C. Tung, Y. H. Hsieh, T. Omatsu, K. F. Huang, Y. F. Chen. Generating laser transverse modes analogous to quantum Green’s functions of two-dimensional harmonic oscillators[J]. Photonics Research, 2017, 5(6): 733
- Photonics Research
- Vol. 5, Issue 6, 733 (2017)
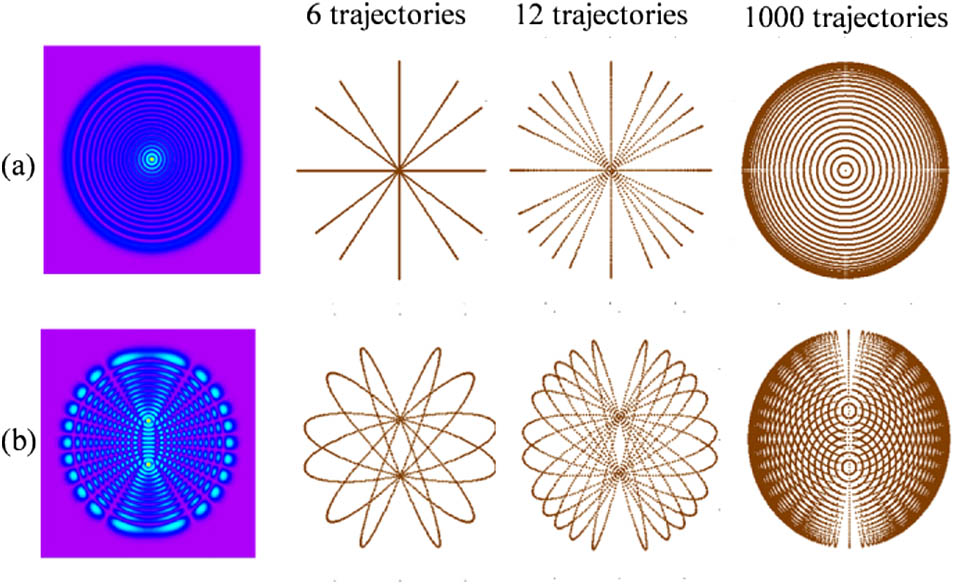
Fig. 1. Calculated results to display the correspondence between quantum Green’s functions and classical periodic-orbit bundles for two cases: (a) ( x ˜ s , y ˜ s ) = ( 0 , 0 ) ( x ˜ s , y ˜ s ) = ( 0 , 2.6 )
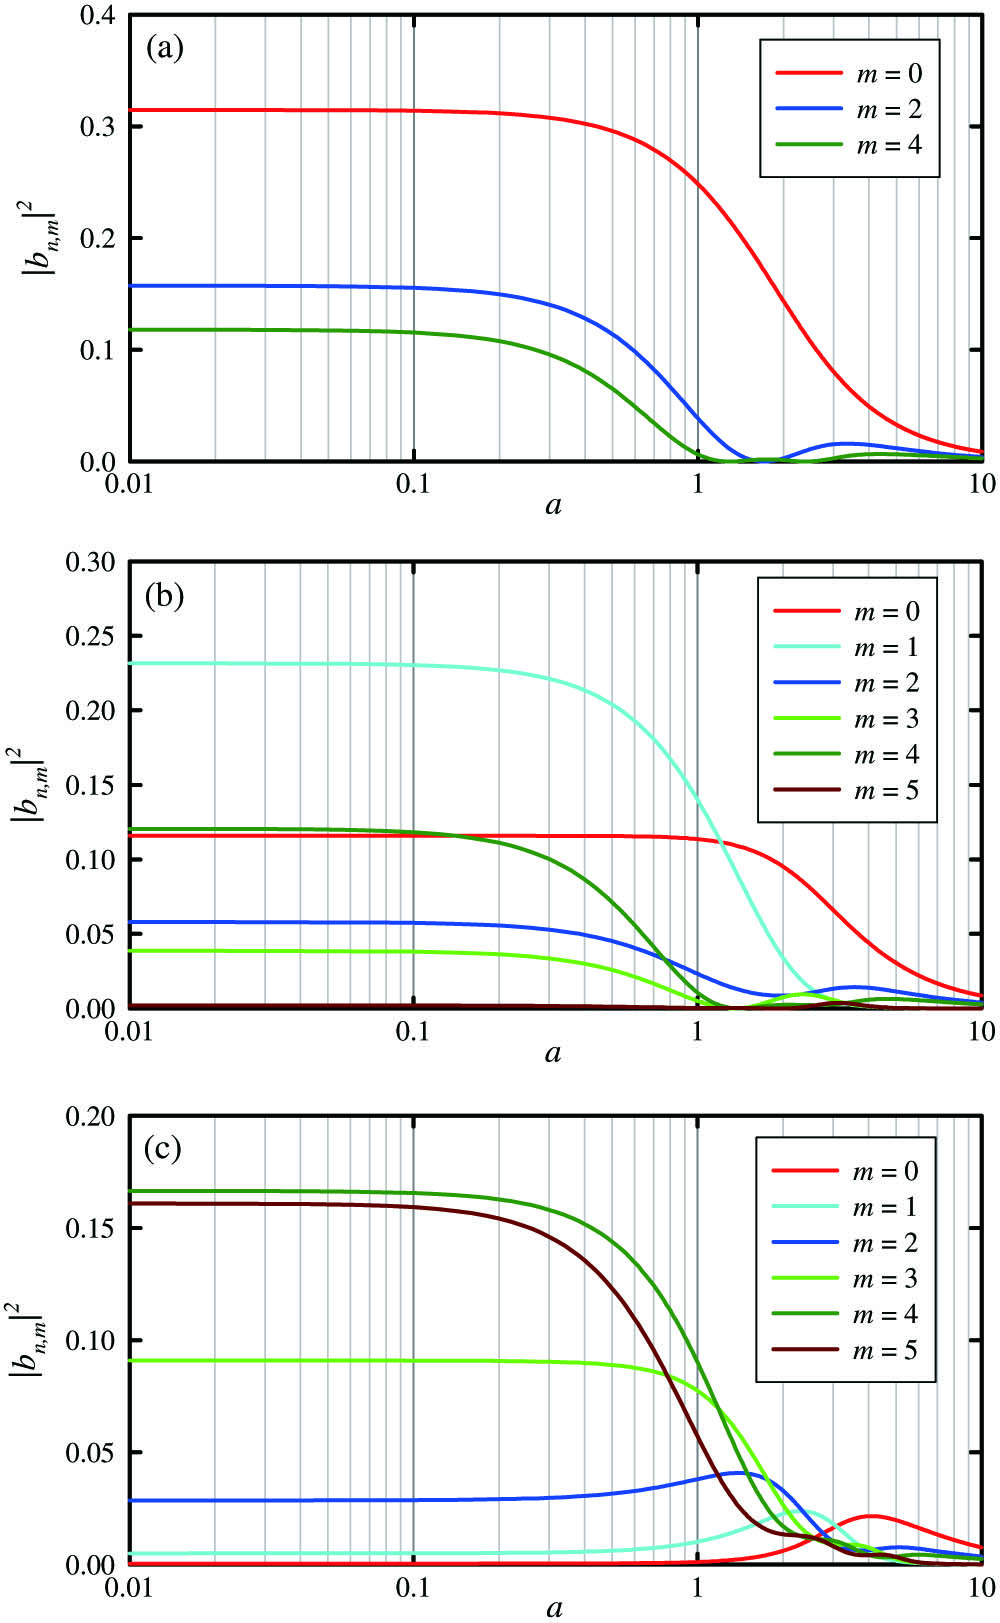
Fig. 2. Numerical calculations for the relationship between the pump-to-mode size ratio and the coefficient | b n , m | 2 y y ˜ s = 0 y ˜ s = 1 y ˜ s = 2.6
Fig. 3. Experimental setup for a solid-state laser selectively end-pumped by a laser diode in a nearly hemispherical cavity.
Fig. 4. Experimental results for the output power and the lasing modes obtained by varying the pump power P in ( x ˜ s , y ˜ s ) = ( 0 , 0 ) | G N ( x ˜ , y ˜ ; 0 ) |
Fig. 5. Calculation result for the coefficient c n , m m y ˜ s y
Fig. 6. Transformed patterns for the lasing modes in Figs. 4(c) and 4(d) . Right side: numerically reconstructed patterns.
Fig. 7. Experimental results for the output power and the lasing modes obtained by varying the pump power P in ( x ˜ s , y ˜ s ) = ( 0 , 1 ) | G N ( x ˜ , y ˜ ; 1 ) |
Fig. 8. Experimental results for the output power and the lasing modes obtained by varying the pump power P in ( x ˜ s , y ˜ s ) = ( 0 , 2.6 ) | G N ( x ˜ , y ˜ ; 2.6 ) |

Set citation alerts for the article
Please enter your email address
© Copyright 2018-2021 | Chinese Laser Press. All Rights Reserved 沪ICP备15018463号-20