• Acta Optica Sinica
  • Vol. 42, Issue 14, 1415001 (2022)
Yunpeng Li1、2, Baozhen Ge1、2、*, Qingguo Tian1、2, and Lü Qieni1、2
Author Affiliations
  • 1School of Precision Instrument and Opto-Electronics Engineering, Tianjin University, Tianjin 300072, China
  • 2Key Laboratory of Opto-Electronic Information Technology, Ministry of Education, Tianjin University, Tianjin 300072, China
  • show less
    DOI: 10.3788/AOS202242.1415001 Cite this Article Set citation alerts
    Yunpeng Li, Baozhen Ge, Qingguo Tian, Lü Qieni. Unbalanced Defocus Dataset Construction Based on Stereo Image Pair Dataset[J]. Acta Optica Sinica, 2022, 42(14): 1415001 Copy Citation Text show less
    Depth-dependent radius of blur kernel
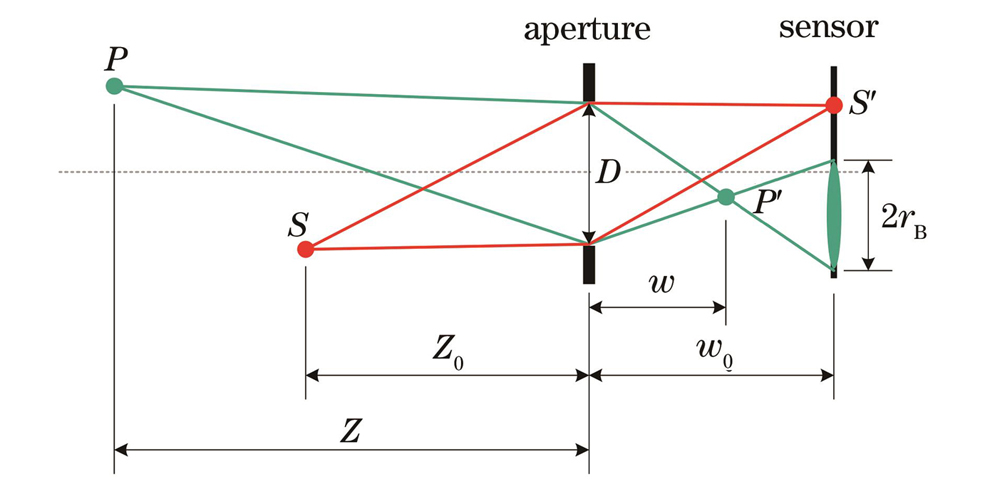
    Fig. 1. Depth-dependent radius of blur kernel
    Data samples in unbalanced defocus stereo vision dataset. (a1)-(a6) Left and right blur images, left and right clear images, and left and right disparity maps of No. 0 data; (b1)-(b6) left and right blur images, left and right clear images, and left and right disparity maps of No. 2000 data
    Fig. 2. Data samples in unbalanced defocus stereo vision dataset. (a1)-(a6) Left and right blur images, left and right clear images, and left and right disparity maps of No. 0 data; (b1)-(b6) left and right blur images, left and right clear images, and left and right disparity maps of No. 2000 data
    Visualized deblurred results of synthetic image. (a1)-(a5) Left blur image, deblurred left images by Nah, DavaNet, and BLNet, and clear left image of No. 0 data; (b1)-(b5) right blur image, deblurred right images by Nah, DavaNet, and BLNet, and clear right image of No. 0 data; (c1)-(c5) left blur image, deblurred left images by Nah, DavaNet, and BLNet, and clear left image of No. 2000 data; (d1)-(d5) right blur image, deblurred right images by Nah, DavaNet, and BLNet, and clear right image of No. 2000 data; (e1)-(e5) left blur image, deblurred left images by Nah, DavaNet, and BLNet, and clear left image of No. 4000 data; (f1)-(f5) right blur image, deblurred right images by Nah, DavaNet, and BLNet, and clear right image of No. 4000 data
    Fig. 3. Visualized deblurred results of synthetic image. (a1)-(a5) Left blur image, deblurred left images by Nah, DavaNet, and BLNet, and clear left image of No. 0 data; (b1)-(b5) right blur image, deblurred right images by Nah, DavaNet, and BLNet, and clear right image of No. 0 data; (c1)-(c5) left blur image, deblurred left images by Nah, DavaNet, and BLNet, and clear left image of No. 2000 data; (d1)-(d5) right blur image, deblurred right images by Nah, DavaNet, and BLNet, and clear right image of No. 2000 data; (e1)-(e5) left blur image, deblurred left images by Nah, DavaNet, and BLNet, and clear left image of No. 4000 data; (f1)-(f5) right blur image, deblurred right images by Nah, DavaNet, and BLNet, and clear right image of No. 4000 data
    Visualized deblurred results of real-scene images in Middlebury 2014 dataset. (a1)-(a5) Left blur image, deblurred left images by Nah, DavaNet, and BLNet, and clear left image of Adirondack; (b1)-(b5) right blur image, deblurred right images by Nah, DavaNet, and BLNet, and clear right image of Adirondack; (c1)-(c5) left blur image, deblurred left images by Nah, DavaNet, and BLNet, and clear left image of Motorcycle; (d1)-(d5) right blur image, deblurred right images by Nah, DavaNet, and BLNet, and clear right image of Motorcycle
    Fig. 4. Visualized deblurred results of real-scene images in Middlebury 2014 dataset. (a1)-(a5) Left blur image, deblurred left images by Nah, DavaNet, and BLNet, and clear left image of Adirondack; (b1)-(b5) right blur image, deblurred right images by Nah, DavaNet, and BLNet, and clear right image of Adirondack; (c1)-(c5) left blur image, deblurred left images by Nah, DavaNet, and BLNet, and clear left image of Motorcycle; (d1)-(d5) right blur image, deblurred right images by Nah, DavaNet, and BLNet, and clear right image of Motorcycle
    Visualized stereo matching results of synthetic image. (a1)-(a5) Left and right blur images, disparity maps of PSMNet-C and PSMNet-B, and ground-truth disparity map of No. 0 data; (b1)-(b5) left and right blur images, disparity maps of PSMNet-C and PSMNet-B, and ground-truth disparity map of No. 2000 data; (c1)-(c5) left and right blur images, disparity maps of PSMNet-C and PSMNet-B, and ground-truth disparity map of No. 4000 data
    Fig. 5. Visualized stereo matching results of synthetic image. (a1)-(a5) Left and right blur images, disparity maps of PSMNet-C and PSMNet-B, and ground-truth disparity map of No. 0 data; (b1)-(b5) left and right blur images, disparity maps of PSMNet-C and PSMNet-B, and ground-truth disparity map of No. 2000 data; (c1)-(c5) left and right blur images, disparity maps of PSMNet-C and PSMNet-B, and ground-truth disparity map of No. 4000 data
    Visualized stereo matching results of real-scene images in Middlebury 2014 dataset. (a1)-(a5) Left and right blur images, disparity maps of PSMNet-C and PSMNet-B, and ground-truth disparity map of Adirondack; (b1)-(b5) left and right blur images, disparity maps of PSMNet-C and PSMNet-B, and ground-truth disparity map of Motorcycle
    Fig. 6. Visualized stereo matching results of real-scene images in Middlebury 2014 dataset. (a1)-(a5) Left and right blur images, disparity maps of PSMNet-C and PSMNet-B, and ground-truth disparity map of Adirondack; (b1)-(b5) left and right blur images, disparity maps of PSMNet-C and PSMNet-B, and ground-truth disparity map of Motorcycle
    Test on real defocus blur images. (a) Stereo vision cameras; (b) experimental scene for test; (c)(d) left and right blur images; (e)(f) deblurred left and right images by BLNet; (g) disparity map calculated by PSMNet-B; (h) reconstructed 3D point clouds
    Fig. 7. Test on real defocus blur images. (a) Stereo vision cameras; (b) experimental scene for test; (c)(d) left and right blur images; (e)(f) deblurred left and right images by BLNet; (g) disparity map calculated by PSMNet-B; (h) reconstructed 3D point clouds
    NumberNahDavaNetBLNet
    PSNRSSIMPSNRSSIMPSNRSSIM
    Average35.510.9534.660.9332.750.93
    036.300.9435.500.9333.490.93
    50039.200.9737.870.9635.380.96
    100037.220.9736.740.9633.580.95
    150034.470.9333.420.9232.290.91
    200036.020.9534.970.9432.440.93
    250035.000.9433.990.9231.460.91
    300033.540.9232.800.9031.950.90
    350033.520.9332.710.9231.650.92
    400034.320.9633.930.9532.470.94
    Table 1. Deblurred results of synthetic image
    SceneNahDavaNetBLNet
    PSNRSSIMPSNRSSIMPSNRSSIM
    Average33.970.9332.770.9130.300.90
    Adirondack38.280.9636.270.9432.680.94
    Motorcycle30.010.9229.550.9127.470.90
    Piano35.360.9533.820.9231.930.92
    Pipes31.790.9031.550.8930.000.89
    Playroom32.000.9431.040.9130.550.91
    Playtable33.310.8730.970.8329.350.82
    Recycle37.540.9636.100.9431.000.95
    Shelves33.450.9432.880.9229.410.92
    Table 2. Deblurred results of real-scene images in Middlebury 2014 dataset
    NumberPSMNet-CPSMNet-B
    D3 /%EPE /pixelD3 /%EPE /pixel
    Average34.496.969.162.01
    040.909.2513.202.63
    50021.303.162.200.74
    100014.905.6310.303.62
    150042.609.7113.502.53
    200046.5011.6110.201.71
    250029.305.537.201.39
    300037.904.8213.102.73
    350037.306.778.301.81
    400039.706.204.400.90
    Table 3. Stereo matching results of the synthetic data
    ScenePSMNet-CPSMNet-B
    D3 /%EPE /pixelD3 /%EPE /pixel
    Average43.737.2126.485.64
    Adirondack42.507.1115.202.97
    Motorcycle40.107.0620.704.42
    Piano33.403.8927.205.45
    Pipes57.2013.5625.606.95
    Playroom44.607.9239.309.91
    Playtable37.005.1625.305.87
    Recycle31.903.9617.802.77
    Shelves63.109.0140.706.81
    Table 4. Stereo matching results of real-scene images from Middlebury 2014 dataset
    Yunpeng Li, Baozhen Ge, Qingguo Tian, Lü Qieni. Unbalanced Defocus Dataset Construction Based on Stereo Image Pair Dataset[J]. Acta Optica Sinica, 2022, 42(14): 1415001
    Download Citation