• Spectroscopy and Spectral Analysis
  • Vol. 42, Issue 4, 1162 (2022)
Ai-yang LI1、*, Liang FU2、2; *;, and Lin CHEN3、3;
Author Affiliations
  • 11. College of Material and Chemical Engineering, Hunan Institute of Technology, Hengyang 421002, China
  • 22. College of Materials Science and Engineering, Chongqing University, Chongqing 400045, China
  • 33. Institute of Chinese Materia Medica, Hunan Academy of Traditional Chinese Medicine, Changsha 410013, China
  • show less
    DOI: 10.3964/j.issn.1000-0593(2022)04-1162-06 Cite this Article
    Ai-yang LI, Liang FU, Lin CHEN. Determination of Trace Heavy Metal Elements in Plant Essential Oils by Inductively Coupled Plasma Optical Emission Spectrometry[J]. Spectroscopy and Spectral Analysis, 2022, 42(4): 1162 Copy Citation Text show less
    Multimode sample introduction system (MSIS) setup for dual mode
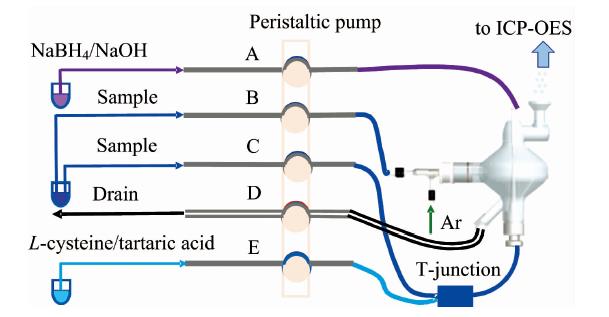
    Fig. 1. Multimode sample introduction system (MSIS) setup for dual mode
    Influence of HCl (a) and NaBH4 (b) concentrations on signal intensity of As, Sn, Sb, and Hg
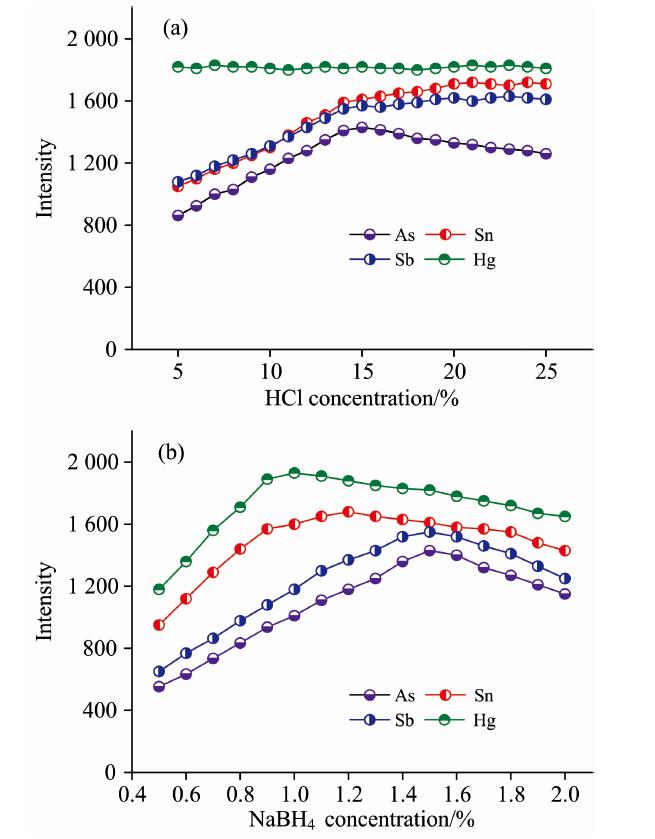
    Fig. 2. Influence of HCl (a) and NaBH4 (b) concentrations on signal intensity of As, Sn, Sb, and Hg
    Spectral interferences for Cd 214.439 nm corrected using FACT
    Fig. 3. Spectral interferences for Cd 214.439 nm corrected using FACT
    StepPower
    /W
    Ramp
    time/min
    Temperature
    /℃
    Hold
    temperature/℃
    11 6005120/
    21 60031505
    3160518015
    Table 1. Operation parameters of microwave digestion
    ElementWavelength/nmlinearity range/(μg·L-1)Dependent coefficient/rMDL/(μg·kg-1)
    Cr267.7160.222001.000 08.25
    Ni231.6040.122000.999 94.50
    As188.9800.152000.999 85.62
    Cd214.4390.072000.999 92.63
    Sn189.9250.052001.000 01.88
    Sb206.8340.172000.999 86.38
    Hg194.1640.012000.999 90.38
    Pb220.3530.312000.999 911.2
    Table 2. The linearity and the method detection limit (MDL) of the analyte
    ElementThis methodFound by ICP-MS
    /(μg·kg-1)
    RE
    /%
    Found
    /(μg·kg-1)
    RSD
    /%
    Spiked
    /(μg·kg-1)
    Total found
    /(μg·kg-1)
    Recovery
    /%
    Cr61.3±3.014.950.0109±3.3895.462.2±1.87-2.1
    Ni30.2±0.662.250.082.3±2.0710430.7±0.45-1.6
    As48.9±2.104.350.099.2±2.1310147.6±1.532.7
    Cd40.3±1.323.350.091.6±1.4510339.5±1.202.0
    Sn16.0±0.553.450.065.3±1.6798.616.3±0.48-1.8
    Sb21.5±0.532.550.072.7±2.8010221.2±0.861.4
    Hg10.8±0.201.950.058.9±1.3696.210.6±0.351.9
    Pb76.2±2.853.750.0125±3.0497.674.9±2.021.7
    Table 3. Accuracy and precision of analytical method (n=6)
    Plant essential oilCrNiAsCdSnSbHgPb
    Mentha canadensis Linnaeus61.3±3.0130.2±0.6648.9±2.1040.3±1.3216.0±0.5521.5±0.5310.8±0.2076.2±2.85
    Citrus limon (L.) Burm. f.87.5±2.6414.6±0.31116±3.2821.5±0.53ND38.6±1.206.21±0.3350.9±1.70
    Rosa rugosa Thunb.NDND71.5±1.8073.6±2.1910.1±0.2030.4±0.92ND96.0±2.13
    Lavandula angustifolia Mill.69.0±2.1832.0±0.68NDNDND17.3±0.51ND41.2±1.55
    Jasminum sambac (L.) AitonNDNDND26.4±0.9718.3±0.2651.0±1.384.58±0.1738.7±1.61
    Syringa oblata Lindl.53.2±1.41ND37.8±1.5930.5±1.10ND12.2±0.3711.5±0.3144.1±0.82
    Rosmarinus officinalis L.47.0±2.36NDNDNDND26.3±0.6415.2±0.4030.5±1.34
    Zanthoxylum bungeanum Maxim.128±3.7225.2±0.5941.5±3.0228.2±0.93ND14.9±0.877.97±0.25103±2.86
    Table 4. Analysis results of plant essential oil samples (μg·kg-1, n=6)
    Ai-yang LI, Liang FU, Lin CHEN. Determination of Trace Heavy Metal Elements in Plant Essential Oils by Inductively Coupled Plasma Optical Emission Spectrometry[J]. Spectroscopy and Spectral Analysis, 2022, 42(4): 1162
    Download Citation