• Laser & Optoelectronics Progress
  • Vol. 59, Issue 22, 2204001 (2022)
Jiayi Wang1 and Zhongxing Duan1、2、*
Author Affiliations
  • 1College of Information and Control Engineering, Xi'an University of Architecture and Technology, Xi'an 710055, Shaanxi, China
  • 2State Key Laboratory of Green Building in Western China, Xi'an 710055, Shaanxi, China
  • show less
    DOI: 10.3788/LOP202259.2204001 Cite this Article Set citation alerts
    Jiayi Wang, Zhongxing Duan. Infrared Thermal Imaging Detection of Surface Cracks in External Insulation Layer of Building Exterior Wall[J]. Laser & Optoelectronics Progress, 2022, 59(22): 2204001 Copy Citation Text show less
    Three-dimensional model of infrared thermal imaging detection for polystyrene foam board. (a) Overall schematic of polystyrene foam board; (b) model meshing
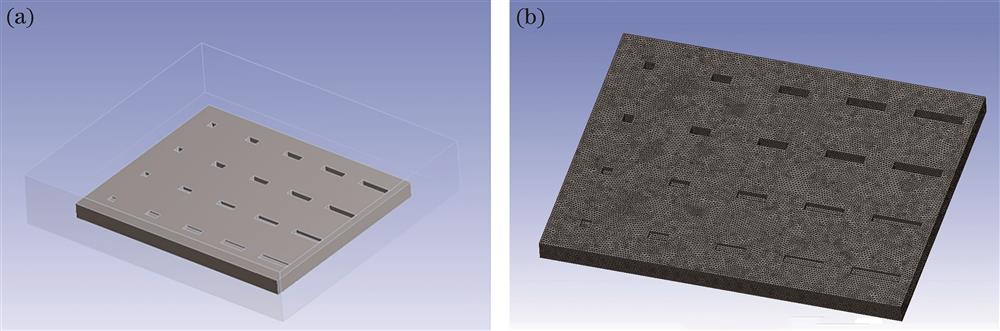
    Fig. 1. Three-dimensional model of infrared thermal imaging detection for polystyrene foam board. (a) Overall schematic of polystyrene foam board; (b) model meshing
    Defect detection system of infrared thermal imaging
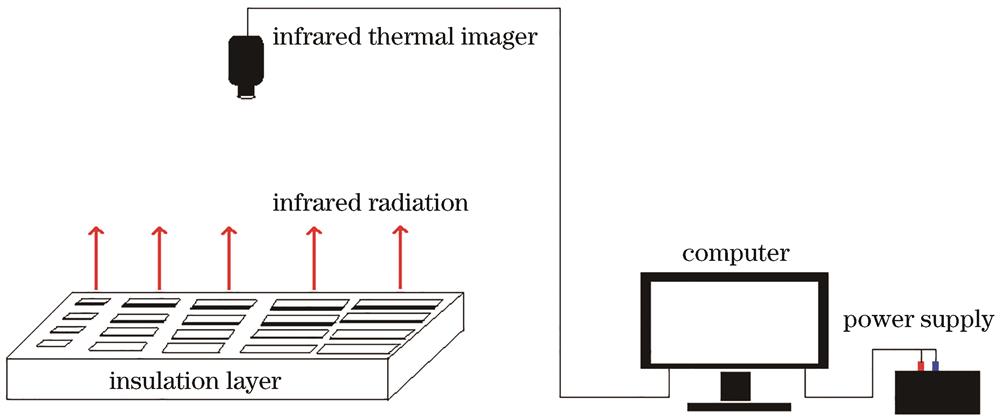
    Fig. 2. Defect detection system of infrared thermal imaging
    Field test results. (a) Material for field experiments; (b) infrared thermography
    Fig. 3. Field test results. (a) Material for field experiments; (b) infrared thermography
    Infrared thermograms of on-site detection at different time. (a) 8∶00; (b) 12∶00; (c) 16∶00
    Fig. 4. Infrared thermograms of on-site detection at different time. (a) 8∶00; (b) 12∶00; (c) 16∶00
    Comparison of measured and calculated values at different thicknesses. (a) 0-mm thick crack; (b) 5-mm thick crack; (c) 10-mm thick crack
    Fig. 5. Comparison of measured and calculated values at different thicknesses. (a) 0-mm thick crack; (b) 5-mm thick crack; (c) 10-mm thick crack
    Relationship between crack width and maximum temperature difference under different thickness
    Fig. 6. Relationship between crack width and maximum temperature difference under different thickness
    Relationship between crack thickness and maximum temperature difference under different width
    Fig. 7. Relationship between crack thickness and maximum temperature difference under different width
    Relationship between crack width and maximum temperature difference under different ambient temperature conditions. (a) 5-mm thick crack; (b) 10-mm thick crack; (c) 20-mm thick crack
    Fig. 8. Relationship between crack width and maximum temperature difference under different ambient temperature conditions. (a) 5-mm thick crack; (b) 10-mm thick crack; (c) 20-mm thick crack
    Relationship between crack thickness and maximum temperature difference under different ambient temperature conditions. (a) 20-mm wide crack; (b) 40-mm wide crack; (c) 60-mm wide crack
    Fig. 9. Relationship between crack thickness and maximum temperature difference under different ambient temperature conditions. (a) 20-mm wide crack; (b) 40-mm wide crack; (c) 60-mm wide crack
    Length /mmWidth /mmThickness /mm

    Specific heat capacity /

    (J·kg-1·K-1

    Density /

    (kg·m-3

    Thermal conductivity /(W·m-1·K-1Absorption coefficient /m-1
    750600401500320.031
    Table 1. Main thermodynamic parameters of polystyrene foam board
    Thickness of crack /mmMaximum temperature difference /℃
    Width of crack is 20 mmWidth of crack is 40 mmWidth of crack is 60 mmWidth of crack is 80 mmWidth of crack is 100 mm
    50.0250.1060.1460.1780.234
    100.0780.2570.2970.3170.376
    200.1780.2870.3230.3980.498
    300.2490.3280.3780.4360.548
    Table 2. Calculation results of maximum temperature difference between crack and non-crack areas of insulation layer under different working conditions
    Jiayi Wang, Zhongxing Duan. Infrared Thermal Imaging Detection of Surface Cracks in External Insulation Layer of Building Exterior Wall[J]. Laser & Optoelectronics Progress, 2022, 59(22): 2204001
    Download Citation