• Photonics Research
  • Vol. 11, Issue 11, A65 (2023)
Jialve Sun1、2, Shui-Jing Tang3, Jia-Wei Meng3, and Changhui Li1、4、*
Author Affiliations
  • 1College of Future Technology, Peking University, Beijing 100871, China
  • 2Peking University Yangtze Delta Institute of Optoelectronics, Nantong 226010, China
  • 3Frontiers Science Center for Nano-optoelectronics and State Key Laboratory for Mesoscopic Physics, School of Physics, Peking University, Beijing 100871, China
  • 4National Biomedical Imaging Center, Peking University, Beijing 100871, China
  • show less
    DOI: 10.1364/PRJ.495267 Cite this Article Set citation alerts
    Jialve Sun, Shui-Jing Tang, Jia-Wei Meng, Changhui Li. Whispering-gallery optical microprobe for photoacoustic imaging[J]. Photonics Research, 2023, 11(11): A65 Copy Citation Text show less
    Concept of the optical microcavity ultrasound probe. A schematic diagram of PA detection is shown in the figure, where ultrasound waves are generated by blood vessels in the tissue excited by pulsed light and then detected using our microprobe. The detailed enlarged diagram of the probe is given in the figure on the left. The mechanism of the ultrasound detection is shown on the right side of the figure.
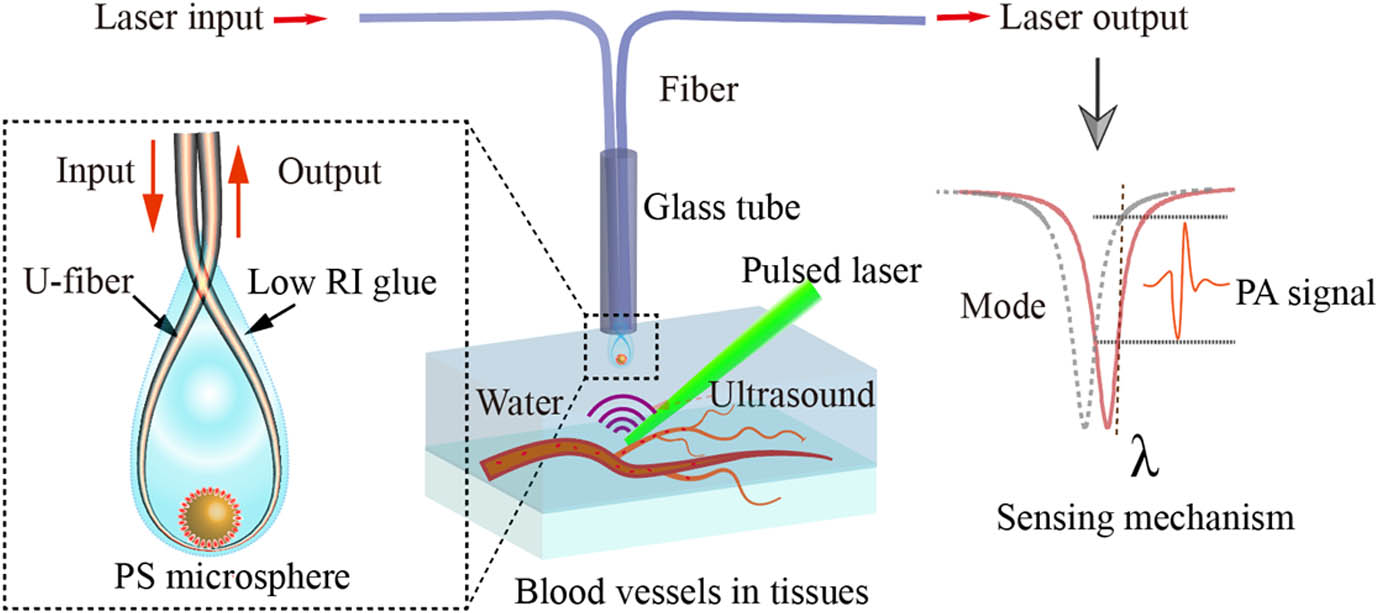
    Fig. 1. Concept of the optical microcavity ultrasound probe. A schematic diagram of PA detection is shown in the figure, where ultrasound waves are generated by blood vessels in the tissue excited by pulsed light and then detected using our microprobe. The detailed enlarged diagram of the probe is given in the figure on the left. The mechanism of the ultrasound detection is shown on the right side of the figure.
    Performance characterization of the encapsulated microsphere microprobe. (a) The Q-factor characterization of the microcavity microprobe. (b) The response of microprobe sensor to the 20 MHz ultrasound. (c) The schematic representation of the angular response of the microprobe sensor. (d) The normalized curve of the angular response to different frequencies.
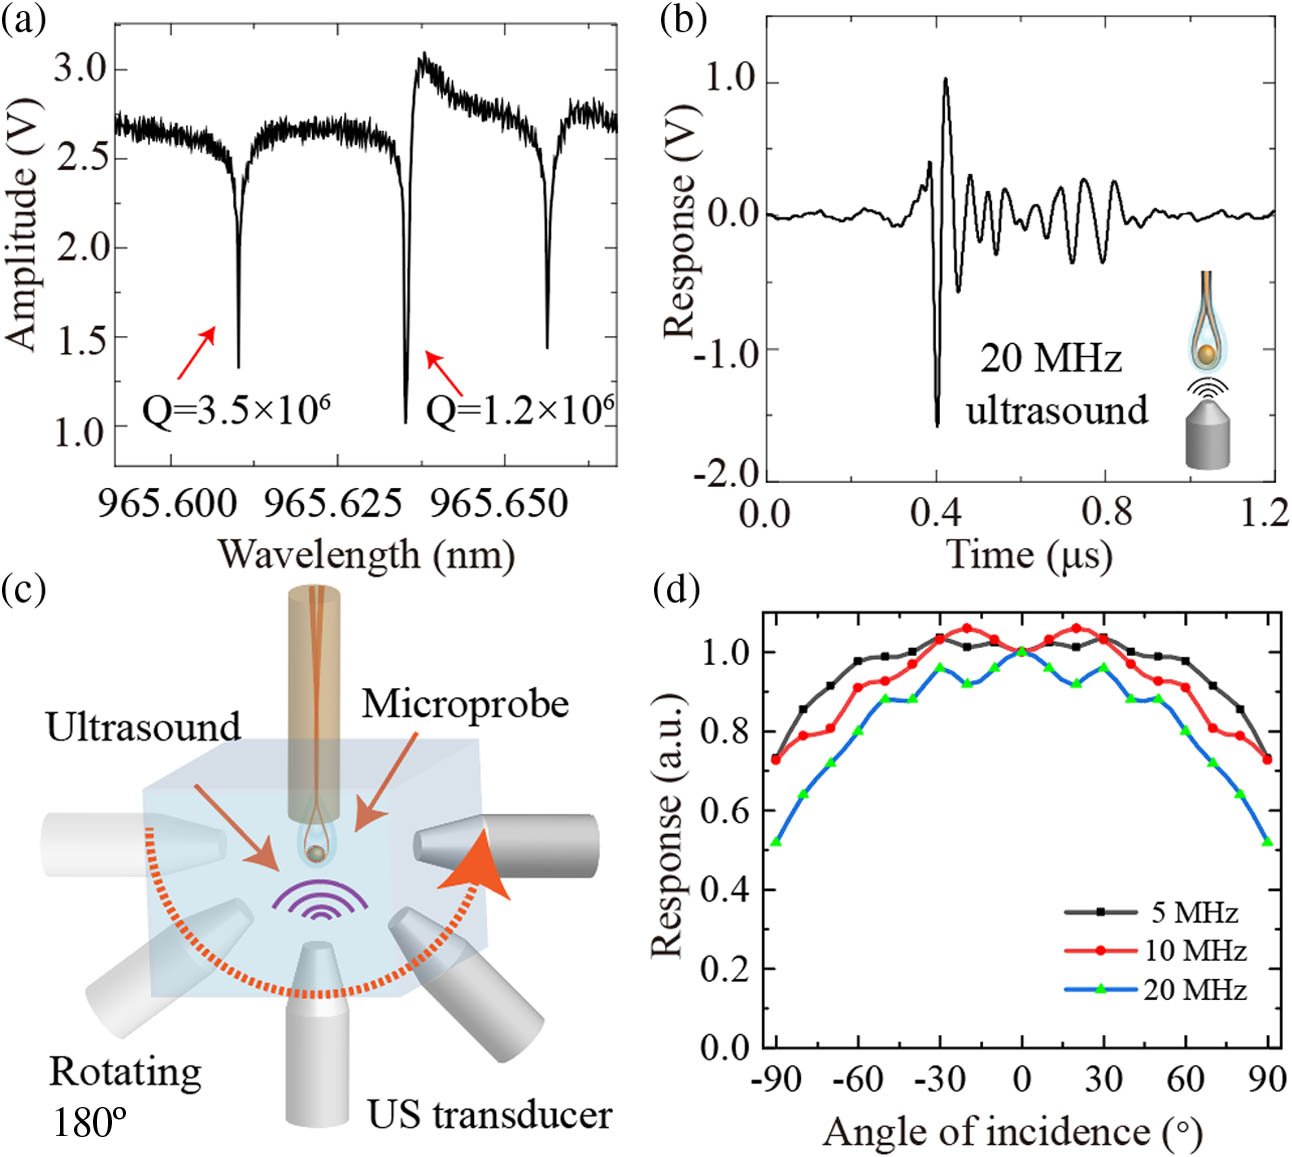
    Fig. 2. Performance characterization of the encapsulated microsphere microprobe. (a) The Q-factor characterization of the microcavity microprobe. (b) The response of microprobe sensor to the 20 MHz ultrasound. (c) The schematic representation of the angular response of the microprobe sensor. (d) The normalized curve of the angular response to different frequencies.
    (a) PAM imaging system. (b) Detection of the PA signals of the 50-nm-gold film. (c) The Fourier transform of the corresponding time-domain signal response in (b).
    Fig. 3. (a) PAM imaging system. (b) Detection of the PA signals of the 50-nm-gold film. (c) The Fourier transform of the corresponding time-domain signal response in (b).
    (a) PA signals of a 20-μm-diameter tungsten wire detected by the microsphere microprobe at different distances. The black points are the measured PA signal data points, and the red curve is the exponential fitting curve. (b) One-dimensional scanning of the thin metal blades to obtain lateral resolution for PA imaging. (c) The blue dots represent the PA signals collected during scanning. The black curve is the fitted curve, and the red curve is the result of further derivation. (d) Maximum amplitude projected image of PA microscopy for a 2 dpf zebrafish. Inset: a bright-field microscopic image of the same zebrafish. (e) Profile views of PA imaging of zebrafish at different depths.
    Fig. 4. (a) PA signals of a 20-μm-diameter tungsten wire detected by the microsphere microprobe at different distances. The black points are the measured PA signal data points, and the red curve is the exponential fitting curve. (b) One-dimensional scanning of the thin metal blades to obtain lateral resolution for PA imaging. (c) The blue dots represent the PA signals collected during scanning. The black curve is the fitted curve, and the red curve is the result of further derivation. (d) Maximum amplitude projected image of PA microscopy for a 2 dpf zebrafish. Inset: a bright-field microscopic image of the same zebrafish. (e) Profile views of PA imaging of zebrafish at different depths.
    Preliminary preparation of the microprobe encapsulation, including (a) pre-fixing the U-shaped fiber, (b) the fabrication of the fiber microneedles, (c) the transfer of the monodisperse microspheres, and (d) the transfer of the glue droplets.
    Fig. 5. Preliminary preparation of the microprobe encapsulation, including (a) pre-fixing the U-shaped fiber, (b) the fabrication of the fiber microneedles, (c) the transfer of the monodisperse microspheres, and (d) the transfer of the glue droplets.
    Photographs during the microprobe production process. (a) The U-shaped microfiber. (b) The transfer of individual microspheres and coupling with tapered fiber. (c) The encapsulated coupled microsphere and U-shaped fiber.
    Fig. 6. Photographs during the microprobe production process. (a) The U-shaped microfiber. (b) The transfer of individual microspheres and coupling with tapered fiber. (c) The encapsulated coupled microsphere and U-shaped fiber.
    Ref.Bandwidth (MHz)NEP (Pa)Q-factorCavity Size (μm)TypeDetectable Angle (°)
    [7]40 (full)2.61.08×105D=125FP probe±90
    [9]30 (full)2201.2×104D=125FP probe±90
    [24]230 (−6 dB)451.5×1040.2×0.5On-chip FP±74
    [27]3–30 (measured)5.51.8×104D=20On-chip microring±60
    [28]140 (−3 dB)6.81.04×104D=60On-chip microring±30
    This work150 (full)4.83.5×106D=30Microsphere probe±90
    Table 1. Comparison of Our Sensor with Other State-of-the-Art Microresonator-Based Acoustic Sensors Used in Photoacoustic Imaging [7,9,24,27,28]a
    Jialve Sun, Shui-Jing Tang, Jia-Wei Meng, Changhui Li. Whispering-gallery optical microprobe for photoacoustic imaging[J]. Photonics Research, 2023, 11(11): A65
    Download Citation