1College of Future Technology, Peking University, Beijing 100871, China
2Peking University Yangtze Delta Institute of Optoelectronics, Nantong 226010, China
3Frontiers Science Center for Nano-optoelectronics and State Key Laboratory for Mesoscopic Physics, School of Physics, Peking University, Beijing 100871, China
4National Biomedical Imaging Center, Peking University, Beijing 100871, China
Optical ultrasonic probes, exemplified by Fabry–Perot cavities on optical fibers, have small sizes, high sensitivity, and pure optical characteristics, making them highly attractive in high-resolution ultrasonic/photoacoustic imaging, especially in near-field or endoscopic scenarios. Taking a different approach, we demonstrate an ultrasensitive and broadband ultrasound microprobe formed by an optical whispering-gallery-mode polymer microcavity coupled to a U-shaped microfiber. With the high-quality () factors (), the noise equivalent pressure of the ultrasound microprobe reaches with a record broadband response of 150 MHz and a large detection angle of 180°. Our results show that this optical microprobe can overcome the strong decay resulting from ultrasound diverging and medium absorption through short working distances. We further demonstrate high-quality in vivo whole-body photoacoustic imaging of a zebrafish larva. Our implementation provides a new strategy for developing miniature ultrasound detectors and holds great potential for broad applications.
1. INTRODUCTION
Optical fiber acoustic sensing technology was rapidly developed in the 1970s [1,2], due to its high accuracy of light wave detection combined with the advantages of optical fiber working frequency bandwidth and small transmission loss. Compared with free-space optical microphones [3,4] and traditional electroacoustic sensors [5,6], optical fiber acoustic sensors [7–9] have the advantages of high sensitivity, high signal-to-noise ratio, wideband response, and large dynamic range. Simultaneously, due to its immunity to electromagnetic interference and its ability to be miniaturized, optical fiber acoustic sensing technology can be employed in environments characterized by high temperatures, high pressures, robust corrosion, intense radiation, and other similar conditions where traditional electroacoustic sensors have difficulty working normally. Therefore, optical fiber acoustic sensors have been valued and widely used in national defense security, industrial non-destructive testing, photoacoustic (PA) imaging diagnosis, and other fields [10–12].
Recently, optical microcavities integrated on optical fibers have attracted considerable interest in ultrasound detection and photoacoustic imaging [13–15]. With the enhanced acousto-optic interaction [16–21], microfiber-coupled microcavity devices can further obtain a noticeable improvement for ultrasound sensing [22–25]. In particular, whispering-gallery-mode (WGM) microcavities with ultrahigh- factors (, is the central wavelength, and is the linewidth of the resonance mode) have shown exceptional detection performances in both sensitivity and bandwidth [26–29]. However, the evanescent coupling between microcavities and fragile microfibers, in order to enable signal readout, disrupts the inherent benefits of optical fiber sensing, notably its small dimensions and high stability as a probe. Additionally, achieving the delicate coupling in aqueous media employed for acoustic transmission remains a challenging task.
In this work, we demonstrate an ultrasensitive and broadband ultrasound microprobe using a WGM microcavity integrated on an optical fiber. The miniature ultrasound detector has a probe tip that encapsulates a 30-μm microspherical polystyrene cavity coupled to a U-shaped tapered microfiber. The high- factors and miniature sizes of the polymer microcavity probe enable a sensitivity up to and record frequency responses up to 150 MHz. Moreover, the small microprobe size not only allows for a large sensing angle over 180° but also enables approaching targets that are much closer, which can significantly reduce the ultrasound signal loss due to transmission diverging and medium attenuation. The high performance of this microprobe is demonstrated by in vivo PA imaging of zebrafish with high-contrast, whole-body microvascular maps. This work provides a new strategy for developing ultrasound microprobes based on highly sensitive WGM microcavities. The new ultrasound (US) microprobe has the broad potential to be implemented in ultrasound/PA endoscopy and near-field detection.
Sign up for Photonics Research TOC. Get the latest issue of Photonics Research delivered right to you!Sign up now
2. EXPERIMENT RESULTS
A. Conception of WGM Microprobe
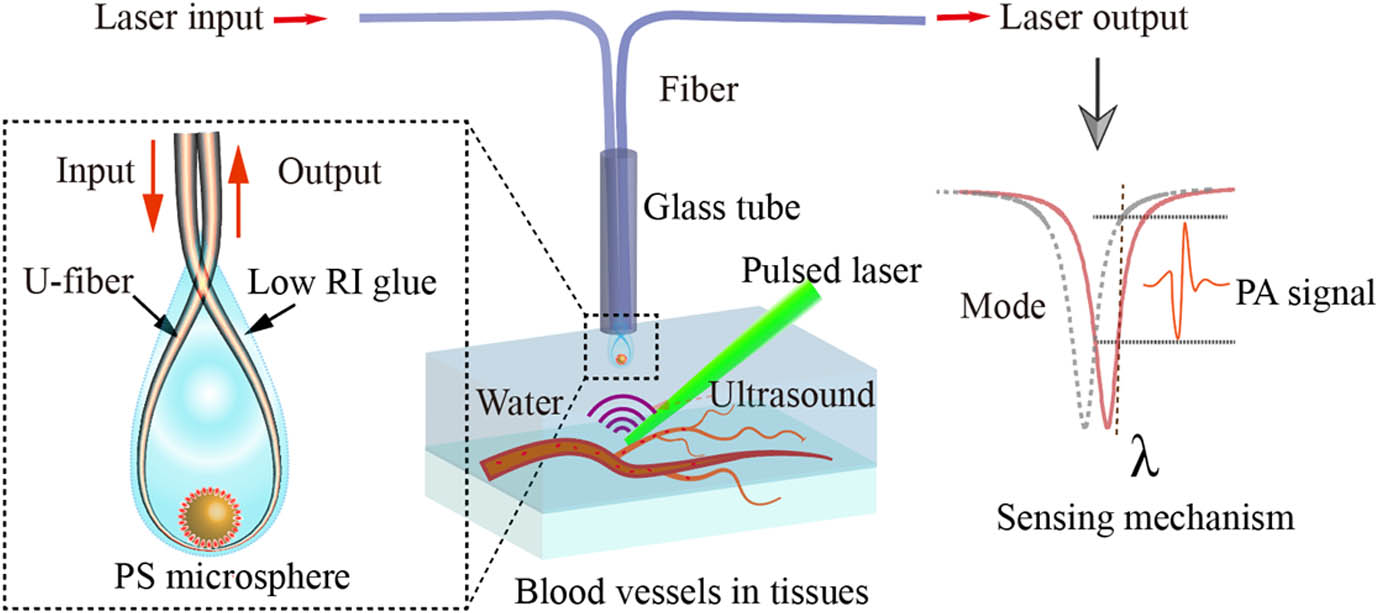
We demonstrate an application scenario in PA detection with a miniature microprobe detector and further show the detailed composition of the microprobe, as shown in Fig. 1. In PA detection and imaging, objects convert the energy absorption of pulsed light into detectable ultrasound signals. In our later experiments, the high-sensitivity microprobe will serve as an important tool for reading out the ultrasound signal, which can be even used in complex environments, including uneven surfaces and pipes. The detection part of the probe tip, shown in the enlarged inset, consists of a U-shaped fiber coupled to a polystyrene microspherical cavity. Such a microprobe can detect the excited PA signal more closely and effectively from the optical absorber. The working principle of the ultrasound probe relies on the ultrasound-induced resonance shift of the microcavity by modulating its refractive index and geometry [13,30]. When the detection wavelength is fixed at the maximum slope of the cavity mode, the frequency and amplitude information of the ultrasound can be read directly by the change of output laser intensity. Experimentally, the needle-like probe is formed by a 30-μm-diameter polystyrene microsphere (refractive index of 1.6) coupled to a U-shaped microfiber, and the whole microcavity-microfiber coupled system, with a low refractive index of 1.33 for stable detection, is encapsulated by glue. This concept of the miniature ultrasound microprobe was first proposed and implemented by us, and the detailed production process is described in Appendix A.
Figure 1.Concept of the optical microcavity ultrasound probe. A schematic diagram of PA detection is shown in the figure, where ultrasound waves are generated by blood vessels in the tissue excited by pulsed light and then detected using our microprobe. The detailed enlarged diagram of the probe is given in the figure on the left. The mechanism of the ultrasound detection is shown on the right side of the figure.
The factor of the encapsulated microprobe is characterized using a 980 nm tunable laser. As shown in Fig. 2(a), multiple sharp cavity modes with high factors exceeding and feasible coupling depths are revealed in the laser transmission. The sensitivity of our microprobe sensor is measured by detecting ultrasound waves from a calibrated flat ultrasound transducer of 20 MHz driven by a pulse/echo receiver. The detected signal after a 1.2–800 MHz band-pass filter is shown in Fig. 2(b). The noise equivalent pressure (NEP) is calculated to be as low as 4.8 Pa at an electronic noise level of 4.6 mV without signal averaging, which is converted to . Next, we further measured the directivity of the microprobe by testing the ultrasound response of the microprobe to different receiving angles. As shown in Fig. 2(c), we fixed the microprobe in the water and then rotated the flat ultrasound transducer 180°. We repeatedly measured the angular response of the microprobe to the ultrasound at 5 MHz, 10 MHz, and 20 MHz frequencies. The normalized directivity response is shown in Fig. 2(d). The −6 dB response covers the entire 180° range among those frequencies that will facilitate the detection of the ultrasound, especially PA/ultrasonic tomography.
Figure 2.Performance characterization of the encapsulated microsphere microprobe. (a) The -factor characterization of the microcavity microprobe. (b) The response of microprobe sensor to the 20 MHz ultrasound. (c) The schematic representation of the angular response of the microprobe sensor. (d) The normalized curve of the angular response to different frequencies.
We then built the PA microscopy (PAM) imaging system, as shown in Fig. 3(a). The PA excitation light is focused upwardly onto the target, and the microprobe detects the PA signal from above. We use a continuously tunable laser at 980 nm as the detection light and a pulsed laser at 532 nm as the PA excitation light. The microprobe sensor and sample are placed in a transparent water tank. The beam width of the 532-nm-pulsed laser is doubled by a lens system and focused on the sample through an objective lens. For PA signal detection, we lock the detection light at the wavelength corresponding to the maximum slope of the mode to obtain the maximum signal response.
Figure 3.(a) PAM imaging system. (b) Detection of the PA signals of the 50-nm-gold film. (c) The Fourier transform of the corresponding time-domain signal response in (b).
To measure the spectral response of our microprobe, we used a 532-nm-pulsed laser (pulse width , pulse energy μ) to irradiate a gold film with a thickness of 50 nm to generate a broadband PA signal. The detected time-domain PA signal is shown in Fig. 3(b), and its Fourier transform result is shown in Fig. 3(c). The results show that the response is broadband, extending to approximately 150 MHz.
Then, taking advantage of the tiny microprobe tip, we explored the PA signal amplitude attenuation along various distances from a small target. A tungsten wire with a diameter of 20 μm was illuminated by a focused pulsed light of 532 nm to serve as a tiny point PA source. As long as the microprobe tip approaches the point source from 6 mm away to 200 μm away, the measured PA signal increases approximately inversely proportional to the source-detector distance, which is shown in Fig. 4(a). Ultrasound diffuses in the form of spherical waves. Therefore, the energy attenuation of the ultrasound is positively correlated with according to the spherical surface area formula; then the attenuation of ultrasonic amplitude is positively correlated with [31]. We then use fitting with an of 0.97. We can see that the fitting curve fits well at closer distances and starts to deviate with larger distances. We think that the attenuation of the signal at a closer distance is mainly caused by the divergence of spherical waves, and as the distance increases, there is not only the effect of divergence but also the attenuation of high-frequency ultrasound. This result demonstrates that the near-field-like detection ability of this microprobe has a large advantage, especially for small objects with weak signals and high frequencies.
Figure 4.(a) PA signals of a 20-μm-diameter tungsten wire detected by the microsphere microprobe at different distances. The black points are the measured PA signal data points, and the red curve is the exponential fitting curve. (b) One-dimensional scanning of the thin metal blades to obtain lateral resolution for PA imaging. (c) The blue dots represent the PA signals collected during scanning. The black curve is the fitted curve, and the red curve is the result of further derivation. (d) Maximum amplitude projected image of PA microscopy for a 2 dpf zebrafish. Inset: a bright-field microscopic image of the same zebrafish. (e) Profile views of PA imaging of zebrafish at different depths.
When performing photoacoustic microscopy, we use a 2D scanning stage to continuously move the sample, with the microcavity and focused spot remaining fixed. We then imaged a sharp blade edge to calibrate the lateral resolution in Fig. 4(b). The detected data points are fitted with a black curve which is the so-called line spread function, as shown in Fig. 4(c). The red curve (the edge spread function) is obtained from the derivation of the black curve, and its full-width at half-maximum (FWHM), which equals 3.4 μm, represents the lateral resolution of the PAM system. We can further improve the lateral resolution by expanding the beam and increasing the numerical aperture of the objective.
To further validate the performance of the microprobe for biomedical imaging, we performed in vivo imaging of a zebrafish two days post-fertilization (dpf). Newborn zebrafish, whose red blood cells are just beginning to be produced, are less abundant, and most of the body is transparent. PA imaging of in vivo zebrafish is a challenge. The zebrafish were depigmented during incubation for better PA imaging of blood vessels (see Appendix A). Then, the zebrafish were anesthetized and fixed with 2% gel in a small glass petri dish. Their physiological state and blood flow were completely normal. We add clean water to the petri dish and place the microprobe sensor directly above the zebrafish. Next, we adjust the focus of the light spot to maximize the PA signal and set the scanning interval of the translation stage. We trigger the pulsed light, the translation stage, and the acquisition card synchronously to perform PA scanning and signal acquisition.
The PA microscopy image of the zebrafish is shown in Fig. 4(d), which shows the maximum amplitude projected image with the distribution of blood vessels in the zebrafish body. The illustration in the upper right corner shows a brightfield microscope of the same zebrafish, and we can see its outline and the distribution of the fishbone. The zebrafish heart is highlighted in the PA image compared to the brightfield image. We can also see that the amount of blood on both sides of the yolk is different and many capillaries can be displayed in the PA image. Further, we give profile views of the PA imaging of zebrafish at different depths, as shown in Fig. 4(e). The vascular distribution of zebrafish is significantly different in tomographic images at different depths. The most obvious is around the eyeball, where a circular lens structure can be seen in the first image. This is due to the fact that the lens is nearly transparent and has weak absorption of pulsed light, while the surrounding blood vessels have strong absorption. The other two images show vascular and pigment distributions in the lower layer of the eye. The distribution of blood around the yolk also varies significantly at different depths. We also estimate the axial resolution of the system to be about 20 μm, based on the imaging of capillaries in the zebrafish.
3. DISCUSSION AND CONCLUSION
In summary, we propose a novel scheme to make a WGM microcavity-based US microprobe, in which we encapsulated a microsphere coupled with a U-shaped optical fiber. Our microprobe has superior comprehensive performance characteristics, including high sensitivity, wide bandwidth, large detection angle, and miniaturization. The NEP of the microprobe sensor can reach 1.07 mPa/√Hz, and our microprobe has a broad frequency response of approximately 150 MHz, which can satisfy most ultrasound medical imaging and PA imaging applications [32,33]. The comparison of our sensor with other state-of-the-art microresonator-based acoustic sensors used in photoacoustic imaging is presented in Table 1. Our sensors have a decisive advantage in comprehensive performances.
Comparison of Our Sensor with Other State-of-the-Art Microresonator-Based Acoustic Sensors Used in Photoacoustic Imaging [7,9,24,27,28]a
Ref.
Bandwidth (MHz)
NEP (Pa)
-factor
Cavity Size (μm)
Type
Detectable Angle (°)
[7]
40 (full)
2.6
FP probe
[9]
30 (full)
220
FP probe
[24]
230 (−6 dB)
45
On-chip FP
[27]
3–30 (measured)
5.5
On-chip microring
[28]
140 (−3 dB)
6.8
On-chip microring
This work
150 (full)
4.8
Microsphere probe
is the diameter of the cavity.
Further, this ultra-large-angle ultrasound response is also beneficial for PA computed tomography, which relies on image reconstruction after the detection of PA signals from different angles. The needle-like microprobe will greatly benefit detecting weak PA signals from small targets since this microprobe can be placed as close as tens of micrometers to the target, substantially reducing the signal loss. We demonstrated the superior performance of this microprobe by in vivo PA microscopy of zebrafish. Our developed microprobe has broad application prospects in the field of biomedicine, such as endoscopy. What is more, this microprobe can be feasibly fabricated in the lab because it does not require special coating like an FP cavity, nor does it require a complicated lithography etching process in micro-nano processing.
Acknowledgment
Acknowledgment. The authors thank Professors Jingwei Xiong and Shiqing Qiu at Peking University for their help in breeding the zebrafish used in the PA imaging experiment. S.-J.T. is supported by the China Postdoctoral Science Foundation.
APPENDIX A: METHODS
1. Microprobe Design and Fabrication
Before the encapsulation of the microprobe, several preliminary preparations need to be done, as shown in Fig. 5. Figure 5(a) shows the fabricated U-shaped taper fiber; Fig. 5(b) represents the usage of a capillary glass tube with an inner diameter of 500 μm to fix the fiber; Fig. 5(c) presents a photograph of the adsorption of one 30-μm-polystyrene microsphere with a fiber microneedle; and Fig. 5(d) shows the operation of using microneedles to transfer microdroplets of glue. We taper the fiber under the drive of the translation stage with the heating of a hydrogen flame. The thinnest part of the tapered optical fiber is only 1 μm, so it needs to be extra careful when doing U-shaped half-folding. Next, we use a carbon dioxide laser to fabricate fiber-optic microneedles and then use the fiber-optic microneedles to perform the transfer of individual microspheres and the glue droplets separately.
Figure 5.Preliminary preparation of the microprobe encapsulation, including (a) pre-fixing the U-shaped fiber, (b) the fabrication of the fiber microneedles, (c) the transfer of the monodisperse microspheres, and (d) the transfer of the glue droplets.
Figure 6.Photographs during the microprobe production process. (a) The U-shaped microfiber. (b) The transfer of individual microspheres and coupling with tapered fiber. (c) The encapsulated coupled microsphere and U-shaped fiber.
The bending radius of the fiber greatly affects the transmittance and packaging difficulty. After many experiments, we have adopted a bending radius between 100 μm and 150 μm, which can not only ensure high transmittance () but also facilitate encapsulation. The gap between the microspheres and the taper fiber needs to be carefully controlled. It is easy to cause excessive gaps and decoupling due to the influence of the glue.
2. Mode Modulation
We use a 980 nm laser (Toptica, wavelength range, 910–980 nm) to scan the mode. The sweep voltage is 140 V (corresponding to the scanning wavelength range of 0.1666 nm), and the scanning frequency is 50 Hz. The laser is transmitted into one terminal of the U-shaped fiber. After passing through the microcavity, the photodetector (New Focus, Model 1811) detects light coming out of another terminal. At the same time, we use the signal generator to send a synchronized TTL signal with the laser to trigger the oscilloscope.
3. Breeding Process of Zebrafish
Zebrafish embryos were incubated in a 28.5°C incubator at a density of about 100 embryos in a 10-cm dish, and the feeding solution was an E3 salt solution (5 mmol/L NaCl, 0.17 mmol/L KCl, 0.33 mmol/L , and 0.33 mmol/L ) with a water pH of 7.3. We used 0.003% PTU (1-phenyl-2-thiourea) diluted in E3 solution to prevent pigmentation in the zebrafish body. After hatching, zebrafish use their yolk as nutrients to gradually form blood flow.
4. Imaging Process
Before imaging, the sample needs to be prepared and fixed on the scanning translation stage. Further, it is necessary to adjust the relative position of the sample, the pulsed light, and the microprobe detector to obtain the maximum signal. During imaging, the STM32 microcontroller is used to synchronously trigger different system components, including the translation stage, the 532-nm-pulsed laser, and the acquisition card (Gage, CS-1422). We use 800 Hz frequency for the scanning imaging. The pulse energy is below 100 nJ, comparable to that used in other OR-PAM in vivo zebrafish imaging studies [34,35]. The acquisition time is about 15 min. The imaging area size is with 5 μm steps. After the acquisition, we use the MATLAB program to reconstruct the image.
5. Measurement of Microprobe Performance
The NEP is an important indicator to represent the sensitivity of ultrasonic detectors. It is given by where is the pressure of the received ultrasound, and SNR stands for signal-to-noise ratio, which is calculated by the formula . A hydrophone (ONDA, HGL-1000) was used to calibrate the sound pressure emitted by the ultrasonic transducer, which meets or exceeds recommendations of Section 3.C.2 of the American Institute of Ultrasound Medicine Acoustic Output Measurement Standard (May 1998).
In this study, we used a commercial 20 MHz flat-head transducer (Panametrics-NDT V317, Olympus) driven by a pulse receiver. We used the hydrophone placed 1 cm away from the normal direction of the flat transducer to measure the actual ultrasound pressure value at this distance. Then, the microprobe replaces the hydrophone with the same distance of 1 cm in water from the flat transducer.
The bandwidth is calculated from the detected PA signal generated by a tiny target. In this study, the target is a thin gold film with a thickness of 50 nm, and the laser pulse width is 2 ns, leading to an original PA pressure wave with a relatively flat spectrum over 300 MHz. This strategy for measuring bandwidth is the mainstream scheme for calibration in the field of photoacoustic imaging.