
Yipeng Zhang, Xiuqing Hu, Dekui Yin, Mingjian Gu. Full Image On-Orbit Polarization Calibration Method of Multi-Angle Polarization Imager[J]. Acta Optica Sinica, 2020, 40(19): 1911001
- Acta Optica Sinica
- Vol. 40, Issue 19, 1911001 (2020)
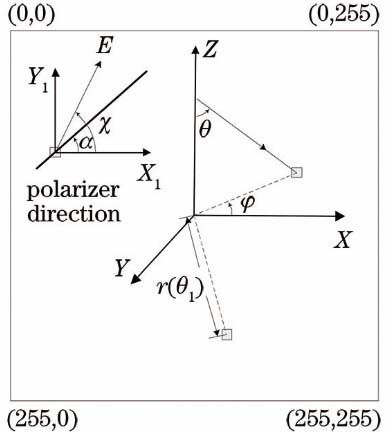
Fig. 1. Imaging coordinate system and relationship among geometric parameters of MAPI image matrix
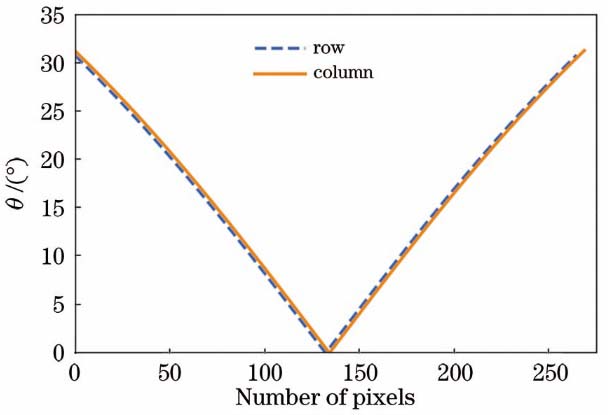
Fig. 2. Relationship between viewing angle θ and pixel position
Fig. 3. Relationship among phase function, polarized phase function, and scattering angle. (a) Relationship between phase function and scattering angle; (b) relationship between polarized phase function and scattering angle
Fig. 4. Flow chart of on-orbit polarization calibration algorithm
Fig. 5. Distribution of polarization degree of optical lens in image matrix
Fig. 6. Variation in polarization degree of optical lens with pixel position
Fig. 7. Distribution of low frequency relative transmittance of optical lens in image matrix
Fig. 8. Variation in low frequency relative transmittance of optical lens with pixel position
Fig. 9. Comparison between on-orbit polarization calibration results and laboratory polarization calibration results. (a) Central field; (b) margin field
Fig. 10. Uncertainty of polarizer channel 1. (a) u(Lr1p) varies with degree of polarization; (b) u(Lr1ε) varies with degree of polarization
Fig. 11. Uncertainty of polarizer channel 2. (a) u(Lr2p) varies with degree of polarization; (b) u(Lr2ε) varies with degree of polarization
Fig. 12. Uncertainty of polarizer channel 3. (a) u(Lr3p) varies with degree of polarization; (b) u(Lr3ε) varies with degree of polarization
|
Table 1. Change of average relative transmittance of filter-polarizer combination in three years
|
Table 2. Fitting curve parameters of polarization degree of optical lens
|
Table 3. Fitting curve parameters of low frequency relative transmittance of optical lens
|
Table 4. Polarization response matrix

Set citation alerts for the article
Please enter your email address
© Copyright 2018-2021 | Chinese Laser Press. All Rights Reserved 沪ICP备15018463号-20