• Photonics Research
  • Vol. 11, Issue 12, 2033 (2023)
Yahui Zhang1,2, Shuiying Xiang1,2,*, Xingxing Guo1, Yanan Han1..., Yuechun Shi3, Xiangfei Chen4, Genquan Han2 and Yue Hao2|Show fewer author(s)
Author Affiliations
  • 1State Key Laboratory of Integrated Service Networks, Xidian University, Xi’an 710071, China
  • 2State Key Discipline Laboratory of Wide Bandgap Semiconductor Technology, Xidian University, Xi’an 710071, China
  • 3Yongjiang Laboratory, Ningbo 315202, China
  • 4Key Laboratory of Intelligent Optical Sensing and Manipulation, Ministry of Education, National Laboratory of Solid State Microstructures, College of Engineering and Applied Sciences, Institute of Optical Communication Engineering, Nanjing University, Nanjing 210023, China
  • show less
    DOI: 10.1364/PRJ.499767 Cite this Article Set citation alerts
    Yahui Zhang, Shuiying Xiang, Xingxing Guo, Yanan Han, Yuechun Shi, Xiangfei Chen, Genquan Han, Yue Hao, "Spiking information processing in a single photonic spiking neuron chip with double integrated electronic dendrites," Photonics Res. 11, 2033 (2023) Copy Citation Text show less
    Operation principle, chip, and experimental setup of FP-SA neuron. (a) Illustration of a biological neuron model receiving excitatory and inhibitory stimulations at functional dendrites. (b) Microscope image of the FP-SA chip and the operation principle of the FP-SA neuron. (c) Experimental setup of the encoding system based on a single FP-SA neuron with double electronic dendrites. Source, voltage source and current source; FPGA, field programmable gate array; CH1, CH2, two channels of FPGA; Bias Tee 1, Bias Tee 2, bias tees; FP-SA, integrated Fabry–Perot laser with an intracavity saturable absorber; OI, optical isolator; VOA, variable optical attenuator; OC, optical coupler; PD, photodetector; OSC, oscilloscope; OSA, optical spectrum analyzer. Red line, electrical signal; blue line, optical signal.
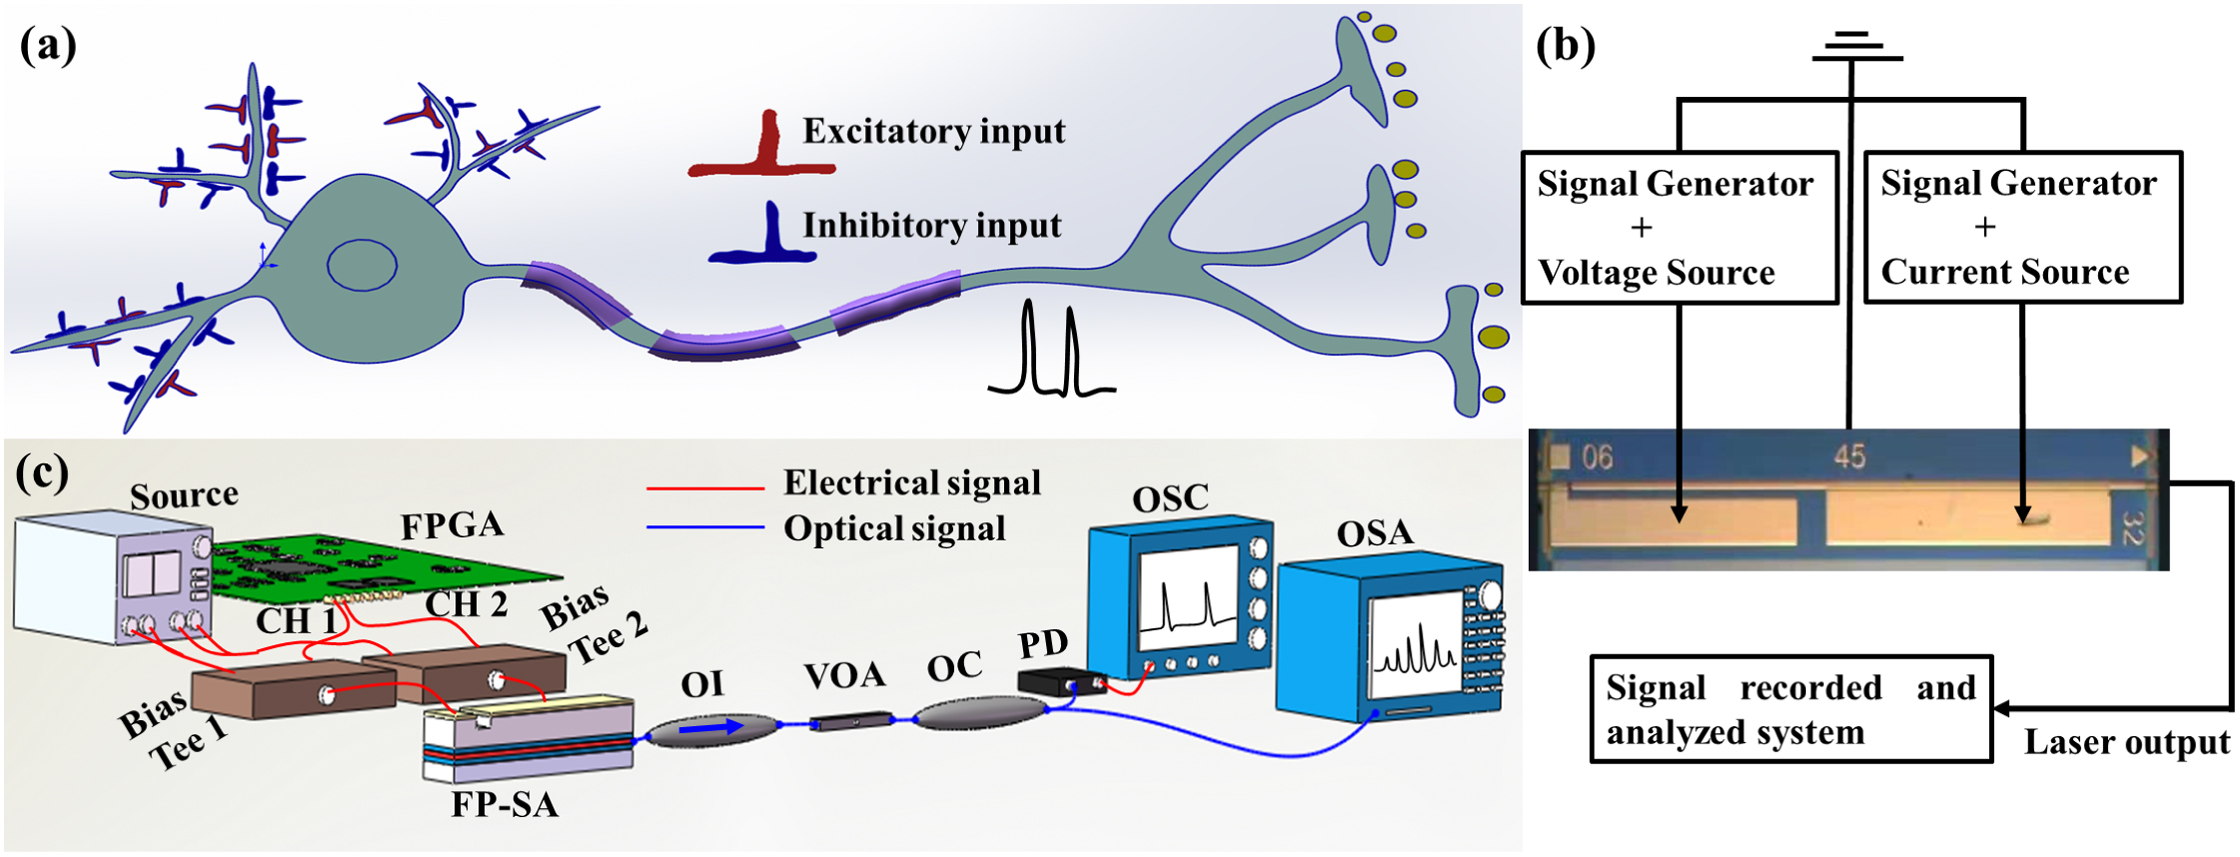
    Fig. 1. Operation principle, chip, and experimental setup of FP-SA neuron. (a) Illustration of a biological neuron model receiving excitatory and inhibitory stimulations at functional dendrites. (b) Microscope image of the FP-SA chip and the operation principle of the FP-SA neuron. (c) Experimental setup of the encoding system based on a single FP-SA neuron with double electronic dendrites. Source, voltage source and current source; FPGA, field programmable gate array; CH1, CH2, two channels of FPGA; Bias Tee 1, Bias Tee 2, bias tees; FP-SA, integrated Fabry–Perot laser with an intracavity saturable absorber; OI, optical isolator; VOA, variable optical attenuator; OC, optical coupler; PD, photodetector; OSC, oscilloscope; OSA, optical spectrum analyzer. Red line, electrical signal; blue line, optical signal.
    Optical spectra and spiking dynamics of the FP-SA neuron. (a) Optical spectra of the FP-SA neuron. (a1) Optical spectrum with IG=50 mA, VSA=0 V; (a2) optical spectrum with IG=91 mA, VSA=−3.8 V. (b) Spikes generated by the FP-SA neuron. (b1) IG=91 mA, VSA=−3.6 V; (b2) IG=100 mA, VSA=−3.6 V; (b3) IG=100 mA, VSA=−3.8 V. (c), (d) Frequencies as functions of IG and VSA.
    Fig. 2. Optical spectra and spiking dynamics of the FP-SA neuron. (a) Optical spectra of the FP-SA neuron. (a1) Optical spectrum with IG=50  mA, VSA=0  V; (a2) optical spectrum with IG=91  mA, VSA=3.8  V. (b) Spikes generated by the FP-SA neuron. (b1) IG=91  mA, VSA=3.6  V; (b2) IG=100  mA, VSA=3.6  V; (b3) IG=100  mA, VSA=3.8  V. (c), (d) Frequencies as functions of IG and VSA.
    Frequency encoding in FP-SA neuron. (a1)–(a6) Excitatory stimulus and corresponding response in FP-SA with IG=90 mA and VSA=−3.9 V. (b1)–(b6) Inhibitory stimulus and corresponding response in FP-SA with IG=90 mA and VSA=−3.9 V. (c1)–(c5) Simultaneous excitatory and inhibitory stimuli and corresponding response in FP-SA with IG=81 mA and VSA=−3.9 V. (a1)–(c1) Excitatory stimulus for gain section. (a2)–(c2) Inhibitory stimulus for saturable absorber section. (a3)–(b3) Response of FP-SA neuron. (a4)–(b4) Spike time interval of spikes in (a3)–(c3). (a5)–(b5) Frequency of spikes in (a3)–(c3). (a6)–(c6) Eye diagram of (a5)–(c5).
    Fig. 3. Frequency encoding in FP-SA neuron. (a1)–(a6) Excitatory stimulus and corresponding response in FP-SA with IG=90  mA and VSA=3.9  V. (b1)–(b6) Inhibitory stimulus and corresponding response in FP-SA with IG=90  mA and VSA=3.9  V. (c1)–(c5) Simultaneous excitatory and inhibitory stimuli and corresponding response in FP-SA with IG=81  mA and VSA=3.9  V. (a1)–(c1) Excitatory stimulus for gain section. (a2)–(c2) Inhibitory stimulus for saturable absorber section. (a3)–(b3) Response of FP-SA neuron. (a4)–(b4) Spike time interval of spikes in (a3)–(c3). (a5)–(b5) Frequency of spikes in (a3)–(c3). (a6)–(c6) Eye diagram of (a5)–(c5).
    Spatiotemporal encoding in FP-SA neuron. (a1)–(a4) Excitatory stimulus and corresponding response in FP-SA with IG=65 mA and VSA=−4.6 V. (b1)–(b4) Inhibitory stimulus and corresponding response in FP-SA with IG=64 mA and VSA=−4.19 V. (c1)–(c4) Simultaneous excitatory and inhibitory stimuli and corresponding response in FP-SA with IG=61.6 mA and VSA=−3.97 V. (a1)–(c1) Excitatory stimulus for gain section. (a2)–(c2) Inhibitory stimulus for saturable absorber section. (a3)–(b3) Response of FP-SA neuron. (a4)–(b4) Overlapped color map of the responses of FP-SA neuron.
    Fig. 4. Spatiotemporal encoding in FP-SA neuron. (a1)–(a4) Excitatory stimulus and corresponding response in FP-SA with IG=65  mA and VSA=4.6  V. (b1)–(b4) Inhibitory stimulus and corresponding response in FP-SA with IG=64  mA and VSA=4.19  V. (c1)–(c4) Simultaneous excitatory and inhibitory stimuli and corresponding response in FP-SA with IG=61.6  mA and VSA=3.97  V. (a1)–(c1) Excitatory stimulus for gain section. (a2)–(c2) Inhibitory stimulus for saturable absorber section. (a3)–(b3) Response of FP-SA neuron. (a4)–(b4) Overlapped color map of the responses of FP-SA neuron.
    Schematic diagram of photonic SNN for the recognition of Iris data set. (a1) Photonic SNN based on frequency encoding. (a2) Photonic SNN based on spatiotemporal encoding. (b) Detailed connection of presynaptic neuron and postsynaptic neuron.
    Fig. 5. Schematic diagram of photonic SNN for the recognition of Iris data set. (a1) Photonic SNN based on frequency encoding. (a2) Photonic SNN based on spatiotemporal encoding. (b) Detailed connection of presynaptic neuron and postsynaptic neuron.
    (a1), (a2) Recognition accuracy of the Iris data set and (b1)–(c2) weight distribution of corresponding photonic SNNs. (a1)–(c1) Corresponding to the architecture of Fig. 5(a1) with the frequency encoding; (a2)–(c2) corresponding to the architecture of Fig. 5(a2) with the spatiotemporal encoding. (b1), (b2) Weight range is [−1, 1]; (c1), (c2) weight rang is [0, 1].
    Fig. 6. (a1), (a2) Recognition accuracy of the Iris data set and (b1)–(c2) weight distribution of corresponding photonic SNNs. (a1)–(c1) Corresponding to the architecture of Fig. 5(a1) with the frequency encoding; (a2)–(c2) corresponding to the architecture of Fig. 5(a2) with the spatiotemporal encoding. (b1), (b2) Weight range is [1, 1]; (c1), (c2) weight rang is [0, 1].
    Recognition accuracy of the Iris data set in noisy photonic SNNs. (a) Corresponding to the architecture of Fig. 5(a1) with the frequency encoding; (b) corresponding to the architecture of Fig. 5(a2) with the spatiotemporal encoding.
    Fig. 7. Recognition accuracy of the Iris data set in noisy photonic SNNs. (a) Corresponding to the architecture of Fig. 5(a1) with the frequency encoding; (b) corresponding to the architecture of Fig. 5(a2) with the spatiotemporal encoding.
    Param.DescriptionValue
    VGGain section cavity volume2.4×1018  m3
    VSASA section cavity volume2.4×1018  m3
    ΓGGain section confinement factor0.06
    ΓSASA section confinement factor0.05
    τGGain section carrier lifetime1 ns
    τSASA section carrier lifetime100 ps
    τphPhoton lifetime4.8 ps
    gGGain section differential gain/loss2.9×1012  m3s1
    gSASA section differential gain/loss14.5×1012  m3s1
    n0GGain section transparency carrier density1.1×1024  m3
    n0SASA section transparency carrier density0.89×1024  m3
    BrBimolecular recombination term10×1016  m3s1
    ηcOutput power coupling coefficient0.4
    βSpontaneous emission coupling factor1×104
    cSpeed of light3×108  m/s
    hPlanck constant6.63×1034  J  s
    eElectron charge1.6×1019  C
    Table 1. Two-Section Laser Parameters
    Yahui Zhang, Shuiying Xiang, Xingxing Guo, Yanan Han, Yuechun Shi, Xiangfei Chen, Genquan Han, Yue Hao, "Spiking information processing in a single photonic spiking neuron chip with double integrated electronic dendrites," Photonics Res. 11, 2033 (2023)
    Download Citation