
Zerun Wang, Yiming Fang, Hailin Feng, Xiaochen Du, Kai Xia. Method for Wooden Knot Detection and Localization[J]. Laser & Optoelectronics Progress, 2018, 55(5): 051501
- Laser & Optoelectronics Progress
- Vol. 55, Issue 5, 051501 (2018)
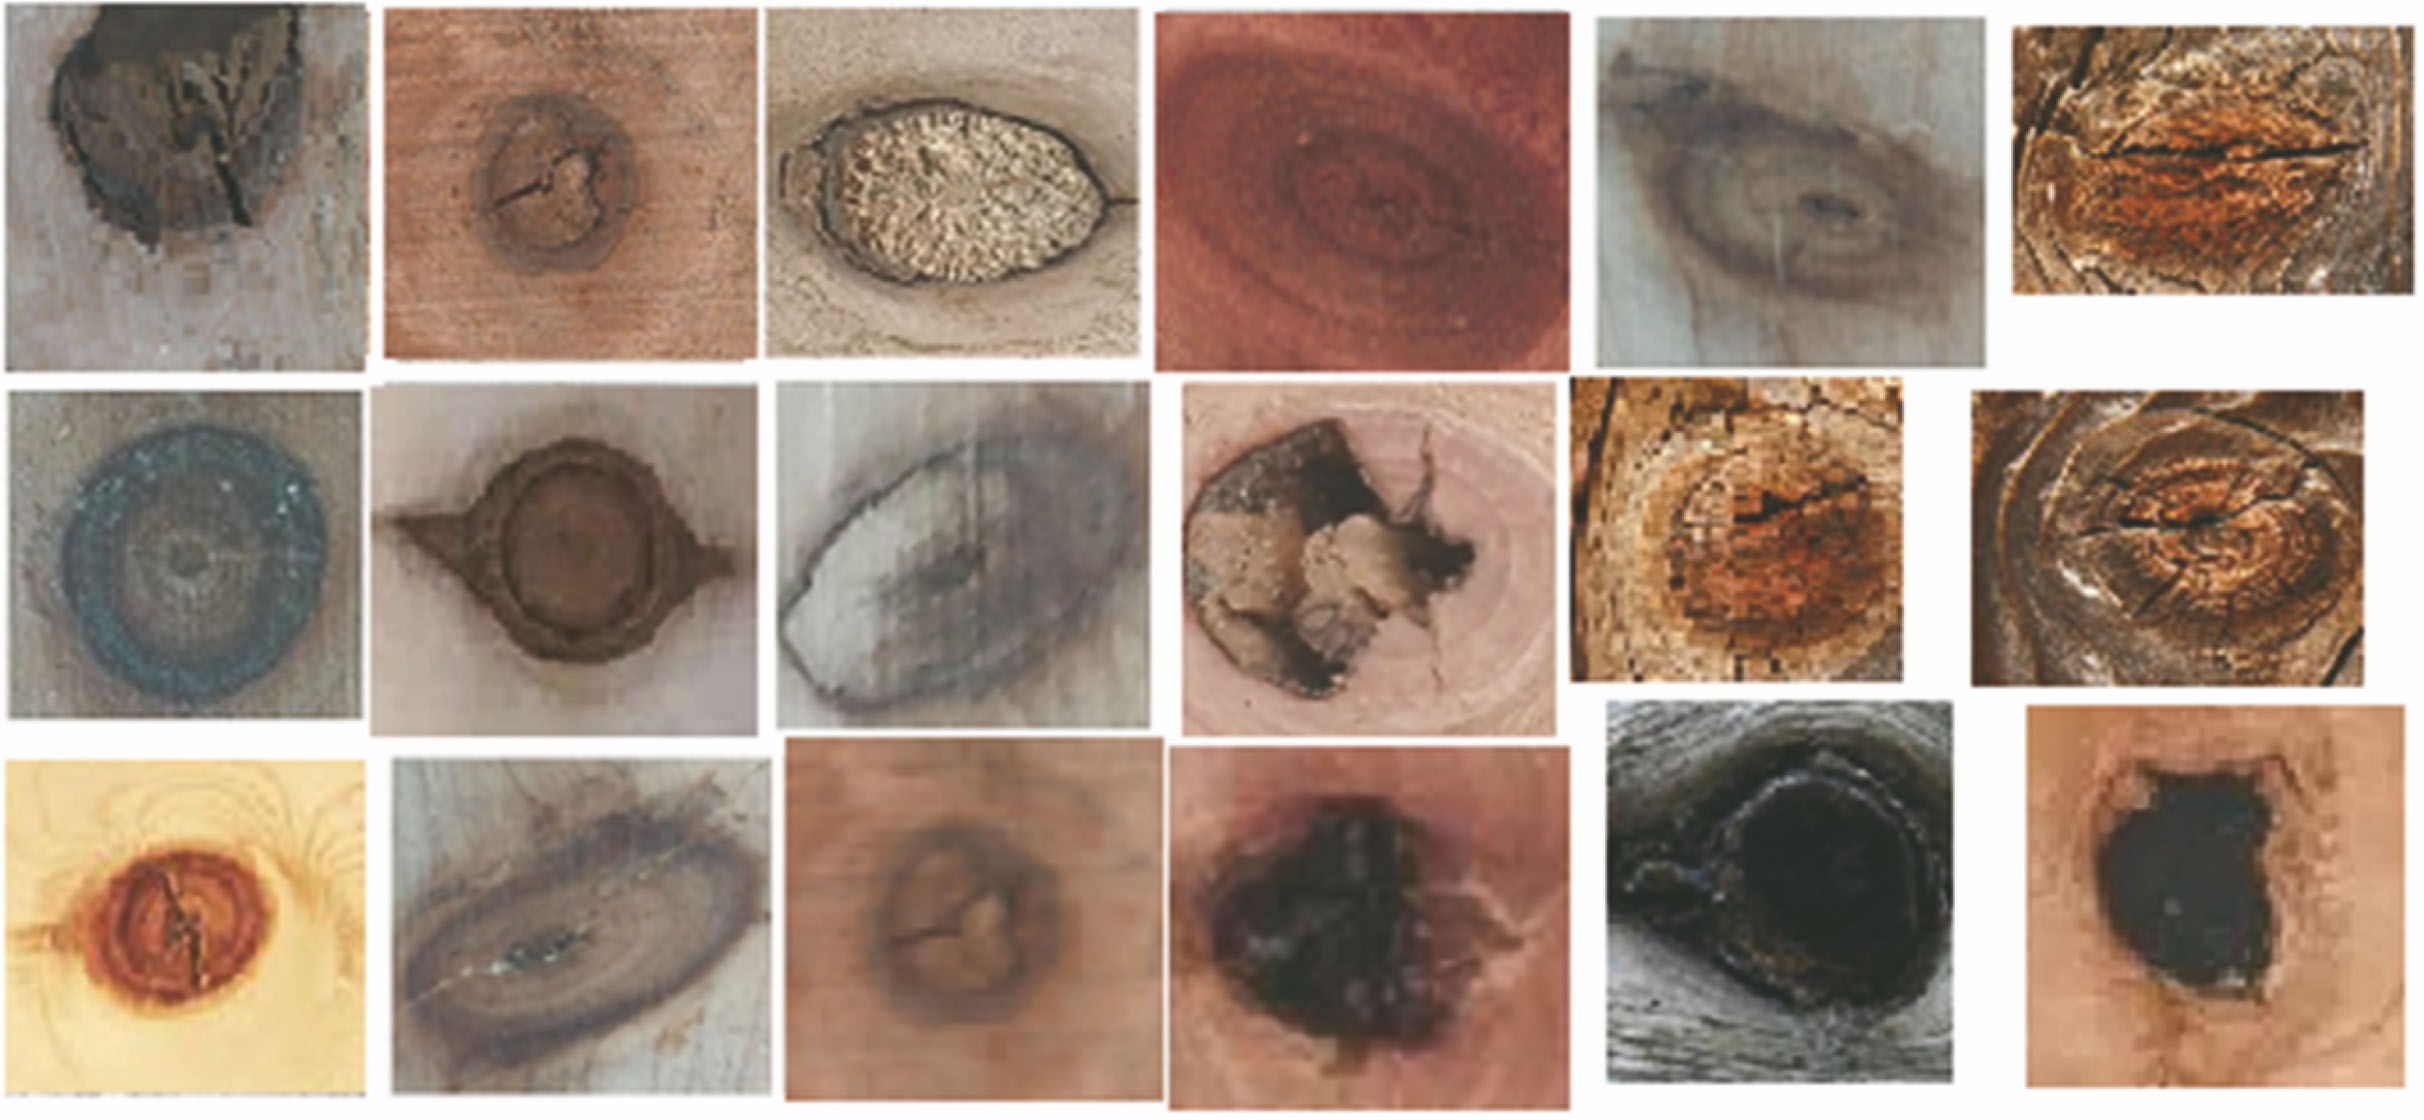
Fig. 1. Typical defective samples
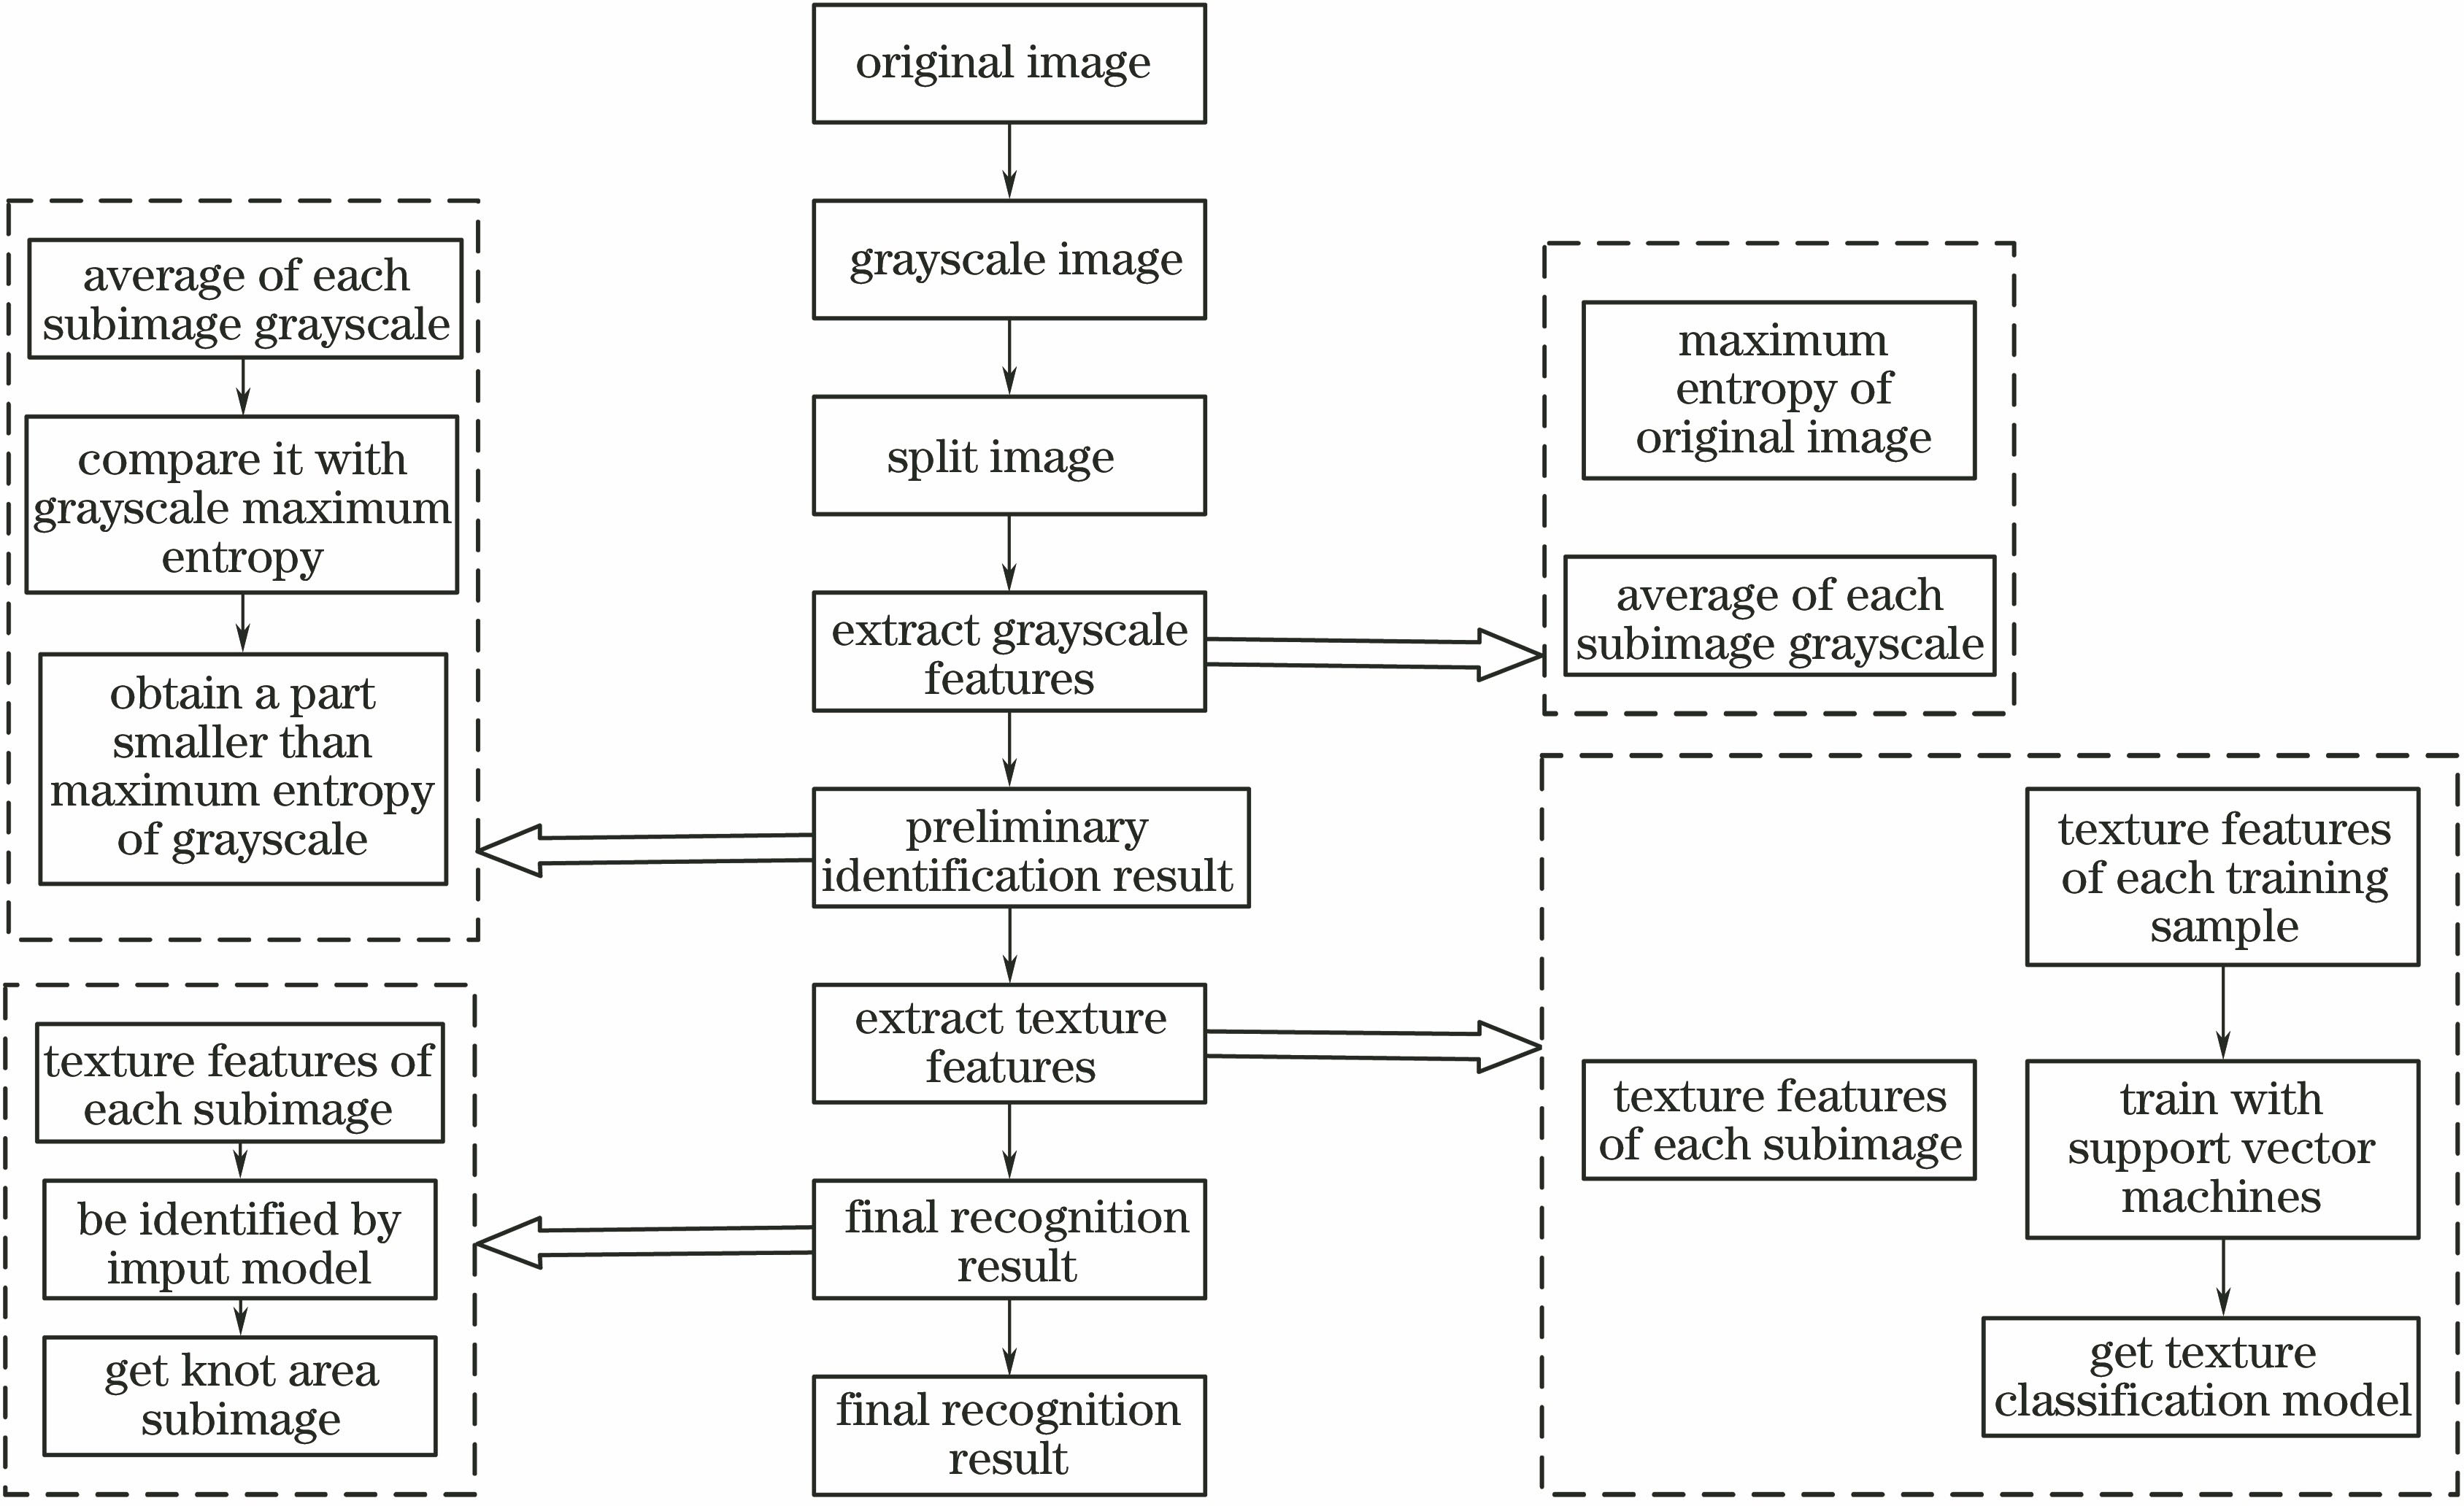
Fig. 2. Flow chart of recognition algorithm
Fig. 3. Illustration of image block
Fig. 4. Original images. (a) Original image of defect of rotary veneer; (b) original image of defect of rotary veneer with texture
Fig. 5. Grayscale images. (a) Grayscale image of rotary veneer; (b) grayscale of rotary veneer with texture
Fig. 6. Grayscale histograms of original images. (a) Grayscale histogram of rotary veneer; (b) grayscale histogram of rotary veneer with texture
Fig. 7. Comparison of gray histograms of normal block and knot block. (a) Gray histogram of normal block of rotary veneer; (b) gray histogram of knot block of rotary veneer; (c) gray histogram of normal block of rotary veneer with texture; (d) gray histogram of knot block of rotary veneer with texture
Fig. 8. Preliminary identification results. (a) Preliminary identification result of rotary veneer; (b) preliminary identification result of rotary veneer with texture
Fig. 9. Parameter optimization result
Fig. 10. Final recognition results. (a) Rotary veneer; (b) rotary veneer with texture
|
Table 1. Four combinations of true and false predictions
|
Table 2. Statistics data of rotary veneers%
|
Table 3. Statistics data of rotary veneers with texture%

Set citation alerts for the article
Please enter your email address
© Copyright 2018-2021 | Chinese Laser Press. All Rights Reserved 沪ICP备15018463号-20