• Photonics Research
  • Vol. 9, Issue 5, B168 (2021)
Zafran Hussain Shah1, Marcel Müller2, Tung-Cheng Wang2, Philip Maurice Scheidig1, Axel Schneider1, Mark Schüttpelz2, Thomas Huser2、3、*, and Wolfram Schenck1、4、*
Author Affiliations
  • 1Faculty of Engineering and Mathematics, Bielefeld University of Applied Sciences, 33619 Bielefeld, Germany
  • 2Faculty of Physics, Bielefeld University, 33615 Bielefeld, Germany
  • 3e-mail: thomas.huser@physik.uni-bielefeld.de
  • 4e-mail: wolfram.schenck@fh-bielefeld.de
  • show less
    DOI: 10.1364/PRJ.416437 Cite this Article Set citation alerts
    Zafran Hussain Shah, Marcel Müller, Tung-Cheng Wang, Philip Maurice Scheidig, Axel Schneider, Mark Schüttpelz, Thomas Huser, Wolfram Schenck. Deep-learning based denoising and reconstruction of super-resolution structured illumination microscopy images[J]. Photonics Research, 2021, 9(5): B168 Copy Citation Text show less
    Schematics of the deep learning CNN architecture of the two different SR-SIM image denoising (RED-fairSIM) and image denoising and reconstruction (SR-REDSIM) methods. In both approaches, a stack of 15 raw (noisy) SIM images (three angles with five phases each) is used as input. The output is the reconstructed SR-SIM image. (a) SR-REDSIM is composed of three main blocks. The encoding block contains mainly the convolutional layers whereas the decoding block consists of deconvolutional layers and the upsampling block of deconvolutional upsampling layers. (b) In the RED-fairSIM method, fairSIM is first used to computationally reconstruct noisy SR-SIM images that are then further propagated into the RED-Net for denoising. The architecture of RED-Net is composed of the encoder and the decoder blocks.
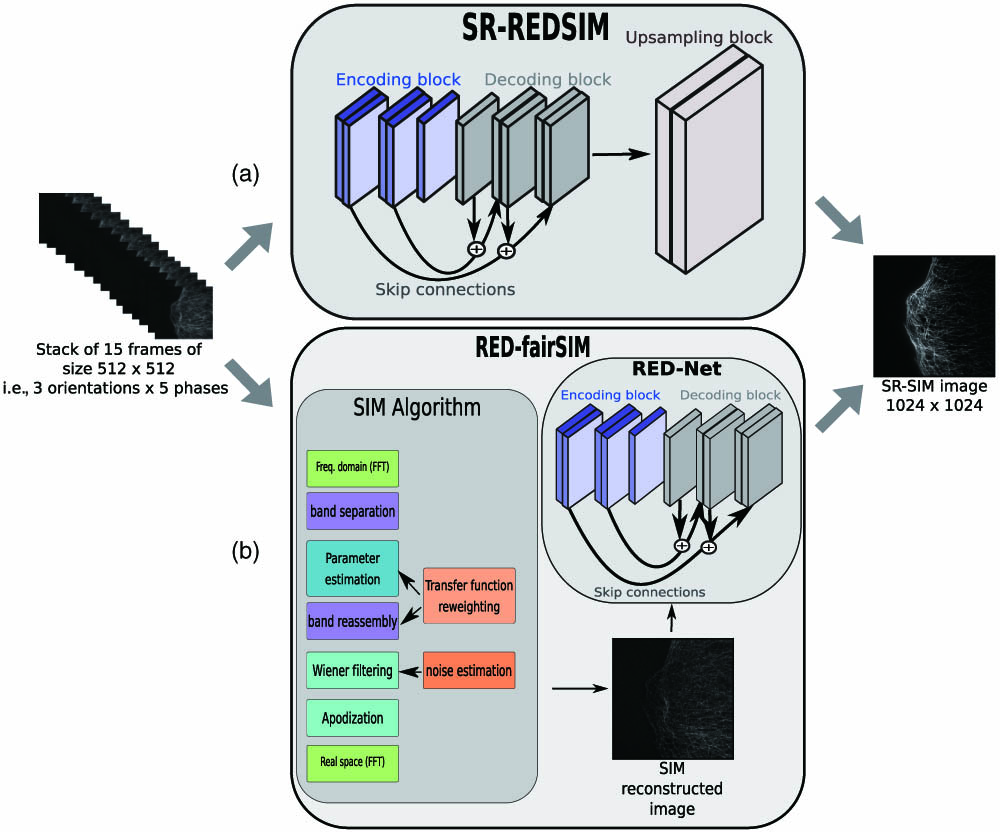
    Fig. 1. Schematics of the deep learning CNN architecture of the two different SR-SIM image denoising (RED-fairSIM) and image denoising and reconstruction (SR-REDSIM) methods. In both approaches, a stack of 15 raw (noisy) SIM images (three angles with five phases each) is used as input. The output is the reconstructed SR-SIM image. (a) SR-REDSIM is composed of three main blocks. The encoding block contains mainly the convolutional layers whereas the decoding block consists of deconvolutional layers and the upsampling block of deconvolutional upsampling layers. (b) In the RED-fairSIM method, fairSIM is first used to computationally reconstruct noisy SR-SIM images that are then further propagated into the RED-Net for denoising. The architecture of RED-Net is composed of the encoder and the decoder blocks.
    The architecture of the networks used in this work. (a) SR-REDSIM architecture is composed of three different blocks. The encoding and decoding blocks contain 21 convolutional and deconvolutional layers, respectively, whereas the upsampling blocks consist only of two upsampling layers. This architecture was used in the SR-REDSIM method to denoise and reconstruct the raw SIM images. (b) The complete RED-Net architecture contains 15 convolutional and 15 deconvolutional layers along with the additive symmetric skip connection layers. This architecture was used in the RED-fairSIM and preRED-fairSIM methods for denoising (in preRED-fairSIM, the input and output have a size of only 512×512×1).
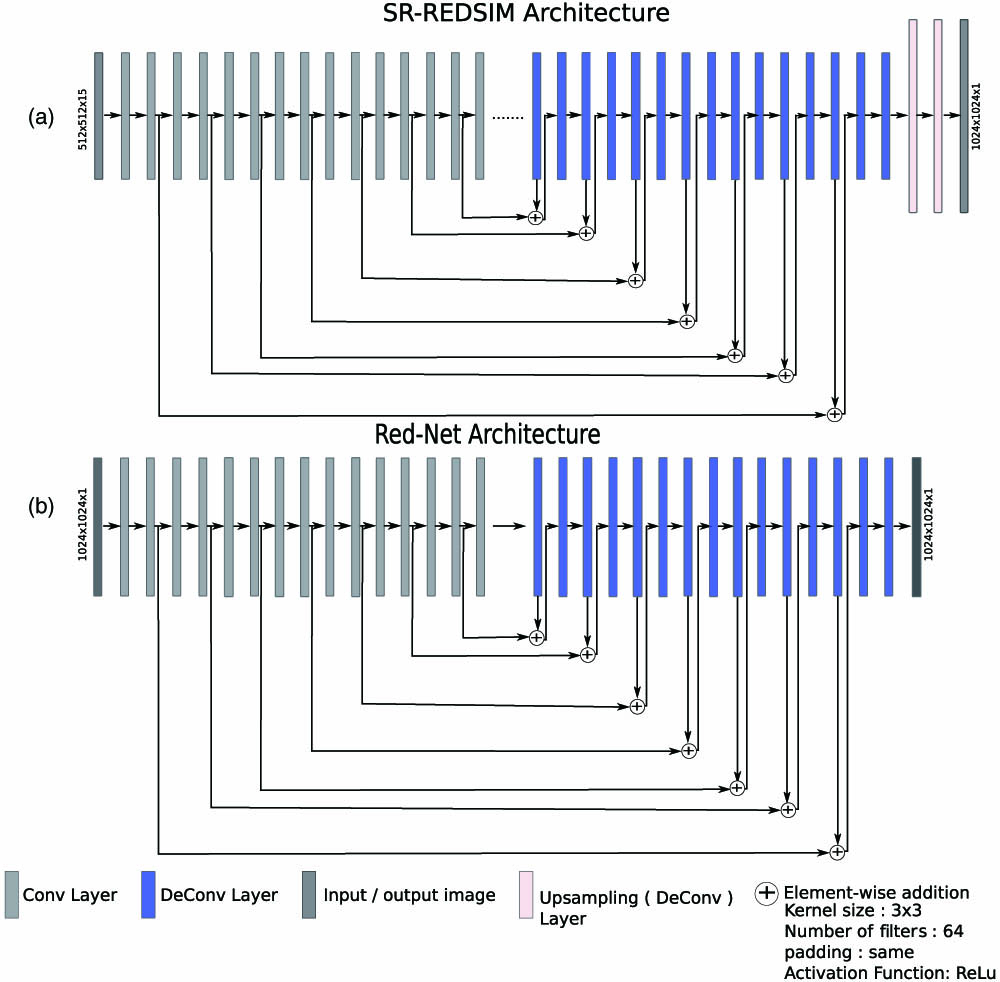
    Fig. 2. The architecture of the networks used in this work. (a) SR-REDSIM architecture is composed of three different blocks. The encoding and decoding blocks contain 21 convolutional and deconvolutional layers, respectively, whereas the upsampling blocks consist only of two upsampling layers. This architecture was used in the SR-REDSIM method to denoise and reconstruct the raw SIM images. (b) The complete RED-Net architecture contains 15 convolutional and 15 deconvolutional layers along with the additive symmetric skip connection layers. This architecture was used in the RED-fairSIM and preRED-fairSIM methods for denoising (in preRED-fairSIM, the input and output have a size of only 512×512×1).
    Super-resolution SIM (SR-SIM) images of three different test samples (U2OS osteosarcoma cells, tubulin cytoskeleton labeled with anti-tubulin-Alexa488) at high-level noise (time stamps 175–199; noise level 4). Each column represents a different reconstruction approach: fairSIM (first column), SR-REDSIM (second column), U-Net-fairSIM (third column), and RED-fairSIM (fourth column). The fifth column depicts the reconstructed reference images which were generated by applying fairSIM image reconstruction to high SNR image data at noise level 0 (lowest noise level; i.e., timestamp 0). All reconstructed SR-SIM images have 1024×1024 pixels. The first, third, and fifth rows correspond to the full-size SR-SIM images, whereas the second, fourth, and sixth rows depict magnified ROIs of the white squares (bounding boxes) indicated in the full-size images. The extracted ROIs of size 100×100 pixels were upsampled to 300×300 pixels using bicubic interpolation for illustration purposes. Scale bar: 4 μm.
    Fig. 3. Super-resolution SIM (SR-SIM) images of three different test samples (U2OS osteosarcoma cells, tubulin cytoskeleton labeled with anti-tubulin-Alexa488) at high-level noise (time stamps 175–199; noise level 4). Each column represents a different reconstruction approach: fairSIM (first column), SR-REDSIM (second column), U-Net-fairSIM (third column), and RED-fairSIM (fourth column). The fifth column depicts the reconstructed reference images which were generated by applying fairSIM image reconstruction to high SNR image data at noise level 0 (lowest noise level; i.e., timestamp 0). All reconstructed SR-SIM images have 1024×1024  pixels. The first, third, and fifth rows correspond to the full-size SR-SIM images, whereas the second, fourth, and sixth rows depict magnified ROIs of the white squares (bounding boxes) indicated in the full-size images. The extracted ROIs of size 100×100  pixels were upsampled to 300×300  pixels using bicubic interpolation for illustration purposes. Scale bar: 4 μm.
    These SR-SIM images show the difference between the output of the SR-REDSIM and RED-fairSIM methods when applied to imaging conditions that the underlying network was not trained for. To evaluate the generalization capabilities of these methods, we again collected tubulin structure (on U2OS cells), but with a different excitation wavelength. Here, the cell is illuminated by light with a wavelength of 642 nm instead of 488 nm (the latter used for the images in the training set). The different wavelength also changes the spatial frequency of the SIM patterns. This cell structure with unseen illumination properties is then propagated through the pretrained models of both SR-REDSIM and RED-fairSIM. The resulting SR-SIM image shows that RED-fairSIM is more robust against changed microscope settings than SR-REDSIM. Scale bar: 4 μm.
    Fig. 4. These SR-SIM images show the difference between the output of the SR-REDSIM and RED-fairSIM methods when applied to imaging conditions that the underlying network was not trained for. To evaluate the generalization capabilities of these methods, we again collected tubulin structure (on U2OS cells), but with a different excitation wavelength. Here, the cell is illuminated by light with a wavelength of 642 nm instead of 488 nm (the latter used for the images in the training set). The different wavelength also changes the spatial frequency of the SIM patterns. This cell structure with unseen illumination properties is then propagated through the pretrained models of both SR-REDSIM and RED-fairSIM. The resulting SR-SIM image shows that RED-fairSIM is more robust against changed microscope settings than SR-REDSIM. Scale bar: 4 μm.
    Reconstruction of SR-SIM images of two different test samples with the fairSIM, U-Net-fairSIM, and RED-fairSIM methods. Each column represents the results of the corresponding method. The first and third rows show the resulting SR-SIM images, whereas the second and fourth rows contain the extracted enlarged ROIs from the full-size images in the rows directly above. The cell structures reconstructed by RED-fairSIM are smoother compared to the U-Net-fairSIM and fairSIM (reference) cell structures. Furthermore, they are more faithful than U-Net-fairSIM when taking the reference as the “gold standard” into account. Scale bar: 4 μm.
    Fig. 5. Reconstruction of SR-SIM images of two different test samples with the fairSIM, U-Net-fairSIM, and RED-fairSIM methods. Each column represents the results of the corresponding method. The first and third rows show the resulting SR-SIM images, whereas the second and fourth rows contain the extracted enlarged ROIs from the full-size images in the rows directly above. The cell structures reconstructed by RED-fairSIM are smoother compared to the U-Net-fairSIM and fairSIM (reference) cell structures. Furthermore, they are more faithful than U-Net-fairSIM when taking the reference as the “gold standard” into account. Scale bar: 4 μm.
    The complete pipeline of the preRED-fairSIM method. In this pipeline, the raw SIM images [512×512 (width×height)] of all phases and orientations are denoised separately with the RED-Net architecture. The complete architecture of RED-Net is shown in Fig. 2. The denoised SIM images of each phase and orientation are then propagated into the fairSIM software in the form of a stack (15 frames) to reconstruct the super-resolution SIM image.
    Fig. 6. The complete pipeline of the preRED-fairSIM method. In this pipeline, the raw SIM images [512×512 (width×height)] of all phases and orientations are denoised separately with the RED-Net architecture. The complete architecture of RED-Net is shown in Fig. 2. The denoised SIM images of each phase and orientation are then propagated into the fairSIM software in the form of a stack (15 frames) to reconstruct the super-resolution SIM image.
    Results for preRED-fairSIM. (a) Three blocks of images where each block consists of six images. The first block depicts the images from phase 0 and orientation 0, the second block from phase 1 and orientation 1, and the third block from phase 2 and orientation 2. The left image in the first row of each block represents a noisy raw SIM image from noise level 4. The second image in each block is the denoised version, whereas the reference image (rightmost in each block) is the ground truth. The Fourier spectra of the images are shown below each image. The dimensions of each image in these blocks are 512×512 (width×height). Scale bar: 8 μm. (b) Three images reconstructed by fairSIM along with their Fourier spectrum directly below. The noisy image (left) is reconstructed using 15 noisy raw SIM images and the parameter fit summary is: resolution improvement is (x:1.90,y:1.90,z:1.90), and the modulation estimation is (x:0.310,y:0.341,z:0.332) with the assessment as “weak.” Similarly, the preRED-fairSIM image (middle) is generated using 15 denoised SIM images and the parameter fit summary is: modulation estimation is (x:0.310,y:0.341,z:0.332) and the assessment “weak”; however, there is no improvement in the resolution. The reference image (right) is reconstructed from the raw SIM images with the highest SNR and the parameter fit summary is: resolution improvement is (x:1.90,y:1.90,z:1.90), and the modulation estimation is (x:0.558,y:0.580,z:0.578) with an assessment of “usable.” The Fourier spectrum of preRED-fairSIM shows additional artifacts (white spots) that do not exist in the Fourier spectrum of the reference or the noisy output. Scale bar: 4 μm.
    Fig. 7. Results for preRED-fairSIM. (a) Three blocks of images where each block consists of six images. The first block depicts the images from phase 0 and orientation 0, the second block from phase 1 and orientation 1, and the third block from phase 2 and orientation 2. The left image in the first row of each block represents a noisy raw SIM image from noise level 4. The second image in each block is the denoised version, whereas the reference image (rightmost in each block) is the ground truth. The Fourier spectra of the images are shown below each image. The dimensions of each image in these blocks are 512×512 (width×height). Scale bar: 8 μm. (b) Three images reconstructed by fairSIM along with their Fourier spectrum directly below. The noisy image (left) is reconstructed using 15 noisy raw SIM images and the parameter fit summary is: resolution improvement is (x:1.90,y:1.90,z:1.90), and the modulation estimation is (x:0.310,y:0.341,z:0.332) with the assessment as “weak.” Similarly, the preRED-fairSIM image (middle) is generated using 15 denoised SIM images and the parameter fit summary is: modulation estimation is (x:0.310,y:0.341,z:0.332) and the assessment “weak”; however, there is no improvement in the resolution. The reference image (right) is reconstructed from the raw SIM images with the highest SNR and the parameter fit summary is: resolution improvement is (x:1.90,y:1.90,z:1.90), and the modulation estimation is (x:0.558,y:0.580,z:0.578) with an assessment of “usable.” The Fourier spectrum of preRED-fairSIM shows additional artifacts (white spots) that do not exist in the Fourier spectrum of the reference or the noisy output. Scale bar: 4 μm.
    The reconstructed SR-SIM images of two test samples with different methods. The Fourier spectrum of each SR-SIM image is shown directly below. Each image contains an enlarged ROI at the lower-left bottom. The analysis of ROI of all the methods clearly shows that the results of RED-fairSIM (sixth column) are smoother and more faithful compared to all other methods. Similarly, the Fourier spectra of the RED-fairSIM do not show any additional artifacts in the Fourier space. The SR-SIM images and ROI of SR-REDSIM (fifth column) also show good results; however, there are some artifacts in the high-frequency region of the Fourier spectrum. The ROIs of Hessian SIM (fourth column) do not outperform RED-fairSIM and SR-REDSIM, but do show better results than BM3D (third column). BM3D produces a suppressed cell structure in both of the resultant images. Furthermore, the Fourier spectrum of the BM3D result for the second test sample shows artifacts in both low and high-frequency regions. Scale bar: 4 μm.
    Fig. 8. The reconstructed SR-SIM images of two test samples with different methods. The Fourier spectrum of each SR-SIM image is shown directly below. Each image contains an enlarged ROI at the lower-left bottom. The analysis of ROI of all the methods clearly shows that the results of RED-fairSIM (sixth column) are smoother and more faithful compared to all other methods. Similarly, the Fourier spectra of the RED-fairSIM do not show any additional artifacts in the Fourier space. The SR-SIM images and ROI of SR-REDSIM (fifth column) also show good results; however, there are some artifacts in the high-frequency region of the Fourier spectrum. The ROIs of Hessian SIM (fourth column) do not outperform RED-fairSIM and SR-REDSIM, but do show better results than BM3D (third column). BM3D produces a suppressed cell structure in both of the resultant images. Furthermore, the Fourier spectrum of the BM3D result for the second test sample shows artifacts in both low and high-frequency regions. Scale bar: 4 μm.
    Reconstructed SR-SIM images at different noise levels with the SR-REDSIM and RED-fairSIM methods for a single field of view. Noise level 0 represents the reference image at timestamp 0, noise level 1 comprises the images from timestamps 25–50, noise level 2 from timestamps 75–100, noise level 3 from timestamps 125–150, and noise level 4 from timestamps 175–200. Each full image contains an enlarged ROI in the bottom left. The images reconstructed by fairSIM in the first row show a significant degradation in quality as the noise level increases. In contrast, the results produced by SR-REDSIM and RED-fairSIM in the second and third columns are far less, depending on the noise level. Scale bar: 4 μm.
    Fig. 9. Reconstructed SR-SIM images at different noise levels with the SR-REDSIM and RED-fairSIM methods for a single field of view. Noise level 0 represents the reference image at timestamp 0, noise level 1 comprises the images from timestamps 25–50, noise level 2 from timestamps 75–100, noise level 3 from timestamps 125–150, and noise level 4 from timestamps 175–200. Each full image contains an enlarged ROI in the bottom left. The images reconstructed by fairSIM in the first row show a significant degradation in quality as the noise level increases. In contrast, the results produced by SR-REDSIM and RED-fairSIM in the second and third columns are far less, depending on the noise level. Scale bar: 4 μm.
     Mean PSNR (STD) and SSIM (STD) Values at Different Noise Levels
    Noise level 1Noise level 2Noise level 3Noise level 4
    PSNR(STD)SSIM(STD)PSNR(STD)SSIM(STD)PSNR(STD)SSIM(STD)PSNR(STD)SSIM(STD)
    fairSIM28.84(2.47)0.69(0.10)25.83(1.70)0.45(0.09)24.12(1.64)0.32(0.07)23.61(1.54)0.29(0.07)
    SR-REDSIM26.73(1.93)0.69(0.07)26.65(1.55)0.64(0.07)26.66(1.73)0.64(0.07)26.62(1.79)0.69(0.09)
    U-Net-fairSIM27.44(1.71)0.75(0.08)27.23(1.76)0.69(0.09)26.85(1.70)0.65(0.09)26.80(1.65)0.68(0.10)
    RED-fairSIM28.75(1.86)0.80(0.07)28.67(1.99)0.75(0.08)28.18(2.06)0.70(0.09)27.97(2.01)0.71(0.09)
    Table 1. Mean PSNR and SSIM Values along with the Standard Deviation for All Methods Calculated on 500 Test Images with Respect to the Reference (Highest SNR) Images
     PSNR(STD)SSIM(STD)
    SR-REDSIM26.37(2.07)0.66(0.10)
    U-Net-fairSIM28.05(2.10)0.71(0.09)
    RED-fairSIM28.09(2.04)0.72(0.09)
    Table 2. Mean PSNR and SSIM Values along with Standard Deviations (STD) for Noise Level 4 after Applying Data Augmentation (Computed on 500 Test Images)
    Zafran Hussain Shah, Marcel Müller, Tung-Cheng Wang, Philip Maurice Scheidig, Axel Schneider, Mark Schüttpelz, Thomas Huser, Wolfram Schenck. Deep-learning based denoising and reconstruction of super-resolution structured illumination microscopy images[J]. Photonics Research, 2021, 9(5): B168
    Download Citation