
Hairui Fan, Fan Yang, Xuran Pan, Jie Wen, Xiaoyu Wang. Stereo Matching Algorithm for Improved Census Transform and Gradient Fusion[J]. Acta Optica Sinica, 2018, 38(2): 0215006
- Acta Optica Sinica
- Vol. 38, Issue 2, 0215006 (2018)
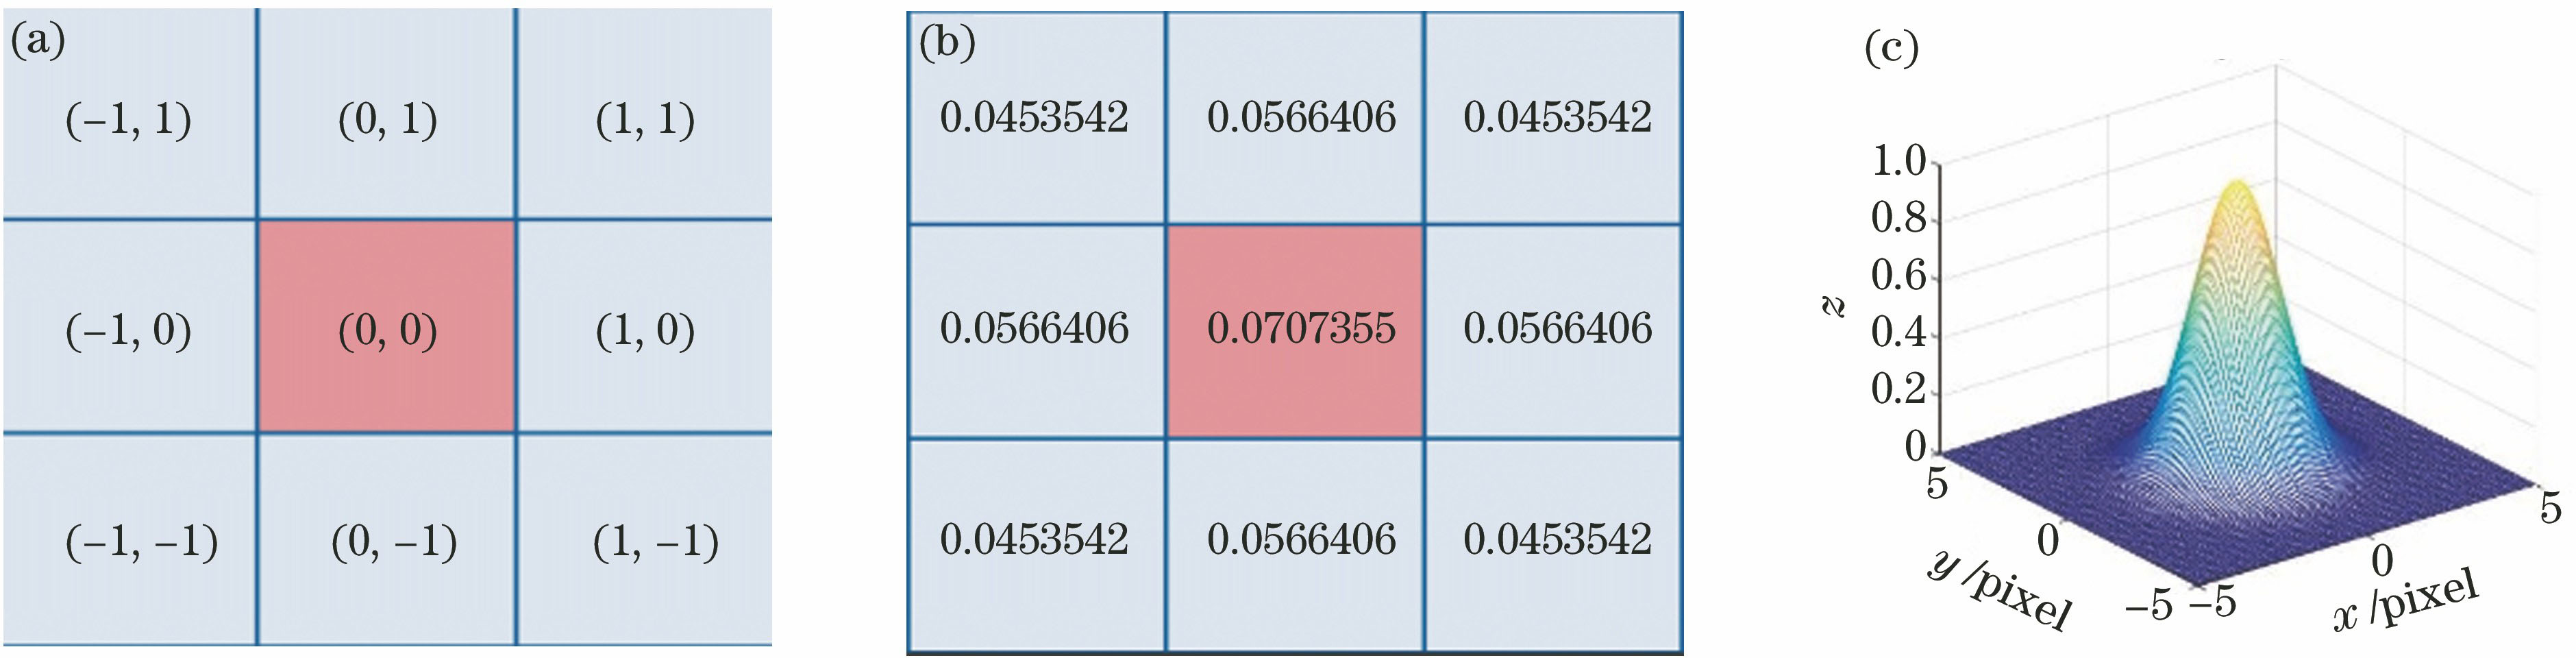
Fig. 1. Support window coordinates and weight distribution map with size of 3×3 and standard deviation of 1.5. (a) coordinate distribution map; (b) weight coordinate distribution map; (c) weight distribution map

Fig. 2. Disparity maps before and after improvement by guidance filter algorithm. (a)(c) before improvement; (b)(d) after improvement
Fig. 3. Disparity maps obtained by different matching cost algorithms. (a) CT; (b) MCT; (c) GRD;(d) proposed algorithm
Fig. 4. Disparity maps obtained by different aggregation algorithms. (a) BoxF, R=10.81%; (b) BF, R=8.12%;(c) GF, R=7.85%; (d) MST, R=8.31%; (e) proposed algorithm, R=7.57%
Fig. 5. Comparison of false matching rates of different cost aggregation algorithms in no-occluded regions
Fig. 6. Test results of different stereo matching algorithms on Aloe image pairs. (a) Aloe left image;(b) Aloe right image; (c) GRD, R=10.19%; (d) MCT, R=10.07%; (e) MCT', R=9.74%; (f) proposed algorithm, R=6.74%
Fig. 7. Test results of different stereo matching algorithms on Baby1 image pairs. (a) Baby1 left image; (b) Baby1 right image; (c) GRD, R=12.82%; (d) MCT, R=4.91%; (e) MCT', R=4.53%; (f) proposed algorithm, R=3.75%
Fig. 8. Test results of different stereo matching algorithms on Bowling2 image pairs. (a) Bowling2 left image; (b) Bowling2 right image; (c) GRD, R=12.91%; (d) MCT, R=15.77%; (e) MCT', R=14.21%; (f) proposed algorithm, R=9.04%
Fig. 9. Test results of different stereo matching algorithms on Dolls image pairs. (a) Dolls left image; (b) Dolls right image; (c) GRD, R=7.66%;(d) MCT, R=11.55%; (e) MCT', R=11.87%; (f) proposed algorithm, R=5.77%
Fig. 10. Experimental results of proposed algorithm on Middlebury2.0 image pairs. (a) Testing left image; (b) standard disparity map; (c) disparity map of proposed algorithm(without disparity refinement); (d) mismatched map (without disparity refinement); (e) disparity maps obtained by proposed algorithm (disparity refinement); (f) mismatched map (disparity refinement)
|
Table 1. Parameters involved in proposed stereo matching algorithm
|
Table 2. Percentage of false match in no-occluded region of different matching cost algorithms%
|
Table 3. Percentage of false match in all regions of different matching cost algorithms%
| |||||||||||||||||||||||||||||||||||||||||||||||||||||||||||||||||||||||||||||||||||||||||||||||||||
Table 5. False matching rates of different stereo matching algorithms in no-occlusion region and all regions%
| |||||||||||||||||||||||||||||||||||
Table 6. False matching rate of different stereo matching algorithms in no-occluded region
|
Table 7. Average running time of 31 Middlebury stereo pairs with different algorithmss

Set citation alerts for the article
Please enter your email address
© Copyright 2018-2021 | Chinese Laser Press. All Rights Reserved 沪ICP备15018463号-20