
Qi Chen, Zhibao Qin, Xiaoyu Cai, Shijie Li, Zijun Wang, Junsheng Shi, Yonghang Tai. Dynamic Three-Dimensional Reconstruction of Soft Tissue in Neural Radiation Field for Robotic Surgery Simulators[J]. Acta Optica Sinica, 2024, 44(7): 0733001
- Acta Optica Sinica
- Vol. 44, Issue 7, 0733001 (2024)
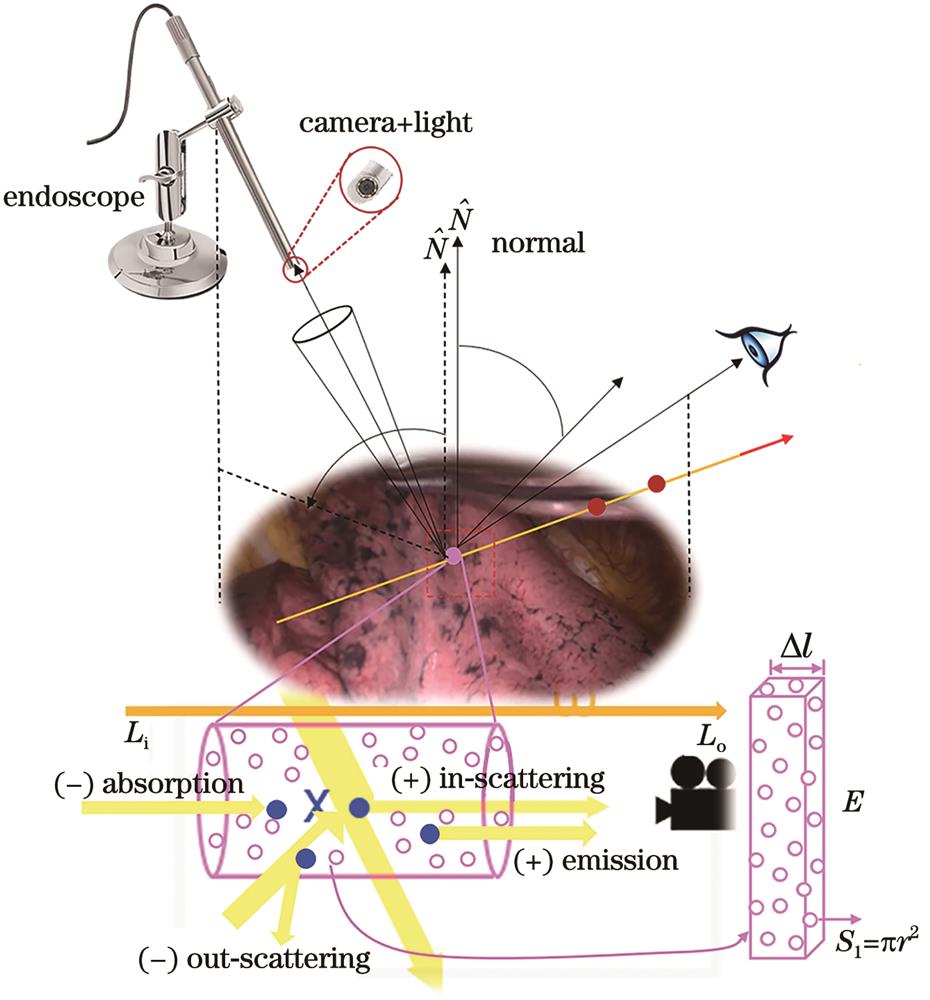
Fig. 1. Schematic of optically based reproduction of color information of soft tissues

Fig. 2. Key implementation steps
Fig. 3. Reconstruct the endoscopic surgery scene into a composite radiation field, and use the SASM to divide the endoscopic surgery scene into three regions: dynamic region, static region, and deformable region
Fig. 4. Overview of the general framework
Fig. 5. By promoting a more concentrated density distribution along each camera ray in the static component, the recovered background contains more highlights to enhance the realism of the image
Fig. 6. Experimental setup and robotic surgical simulation system
Fig. 7. Visualization results of segmentation in real surgical scenes
Fig. 8. Results of each soft tissue reconstruction in the endoscopic scenario of robotic surgery simulation (qualitative)
Fig. 9. Line graphs of color difference of each organ. (a) Lung color difference line graph; (b) kidney color difference line graph; (c) liver color difference line graph
Fig. 10. Different color difference representations indicate that the color of the reconstructed organ is close to the true color of biological soft tissue. (a) Photographed original kidney map; (b) 3D scatter plot of positional color difference; (c) contour map of magnification chromatic aberration; (d) 3D reconstructed kidney map; (e) vector chromatic aberration map in color coded map of R channel; (f) vector chromatic aberration map in color coded map of G channel
Fig. 11. Performance of reconstructed biological soft tissue improves over time (represented by increasing number of iterations)
Fig. 12. Influence of hyperparameters (the number of input images) on reconstruction performance. (a) PSNR; (b) SSIM; (c) MSSIM
Fig. 13. Influence of hyperparameters (number of hidden layers, regularization weights) in hash grids on reconstruction quality. (a) PSNR; (b) MAE; (c) NRMSE
|
Table 1. Dataset reconstructed by the introduction of supervised loss after each soft tissue structure is trained for 50000 times in each robotic surgery simulation scenario, and the dataset is compared with the ground truth

Set citation alerts for the article
Please enter your email address
© Copyright 2018-2021 | Chinese Laser Press. All Rights Reserved 沪ICP备15018463号-20