• Photonics Research
  • Vol. 10, Issue 5, A74 (2022)
Zunyue Zhang1, Yi Wang1, Jiarui Wang2, Dan Yi1, David Weng U Chan1, Wu Yuan2, and Hon Ki Tsang1、*
Author Affiliations
  • 1Department of Electronic Engineering, The Chinese University of Hong Kong, Hong Kong, China
  • 2Department of Biomedical Engineering, The Chinese University of Hong Kong, Hong Kong, China
  • show less
    DOI: 10.1364/PRJ.443039 Cite this Article Set citation alerts
    Zunyue Zhang, Yi Wang, Jiarui Wang, Dan Yi, David Weng U Chan, Wu Yuan, Hon Ki Tsang. Integrated scanning spectrometer with a tunable micro-ring resonator and an arrayed waveguide grating[J]. Photonics Research, 2022, 10(5): A74 Copy Citation Text show less
    Schematic of the integrated scanning spectrometer with tunable MRR and a single AWG. Direct electrical readout is enabled by on-chip germanium photodetectors.
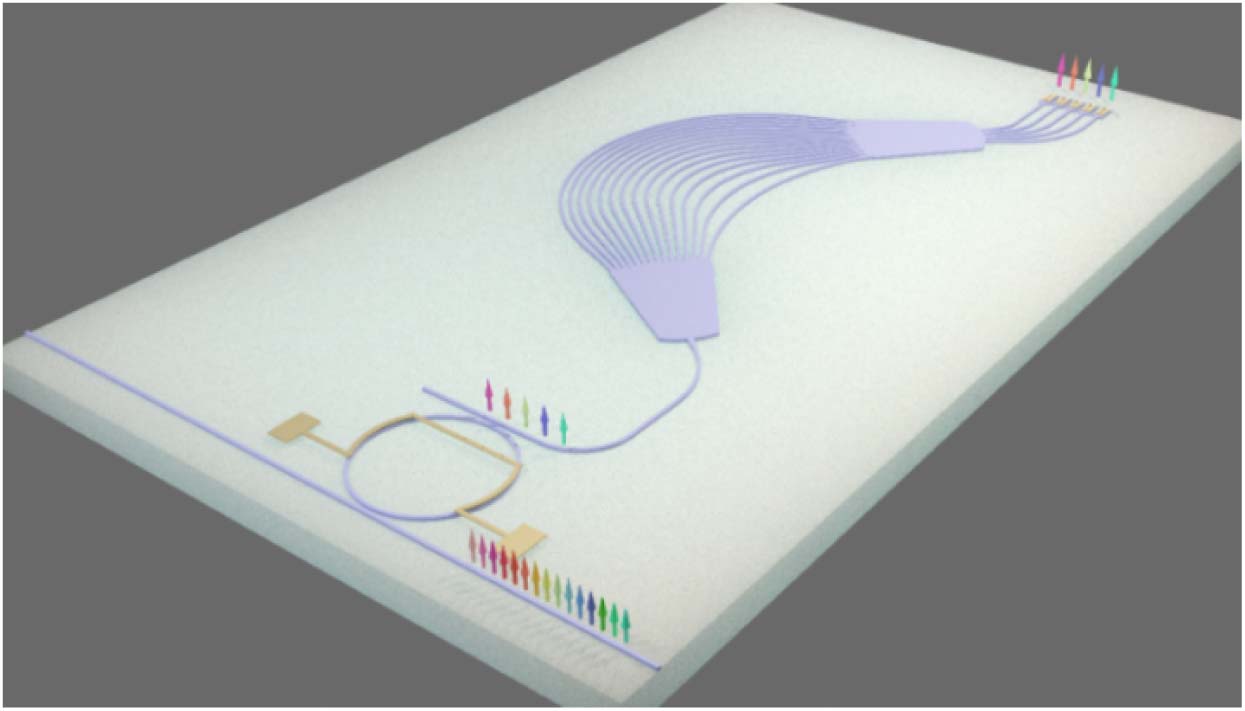
    Fig. 1. Schematic of the integrated scanning spectrometer with tunable MRR and a single AWG. Direct electrical readout is enabled by on-chip germanium photodetectors.
    (a) Waveguide dimension of the MRR. (b) Mode profile in the shallow etched waveguide. (c) Schematic of the bending-shaped directional coupler used in the MRR. (d) Simulated coupling ratio of the designed directional coupler by 3D FDTD simulation. (e) Calculated transmission spectrum of the designed MRR.
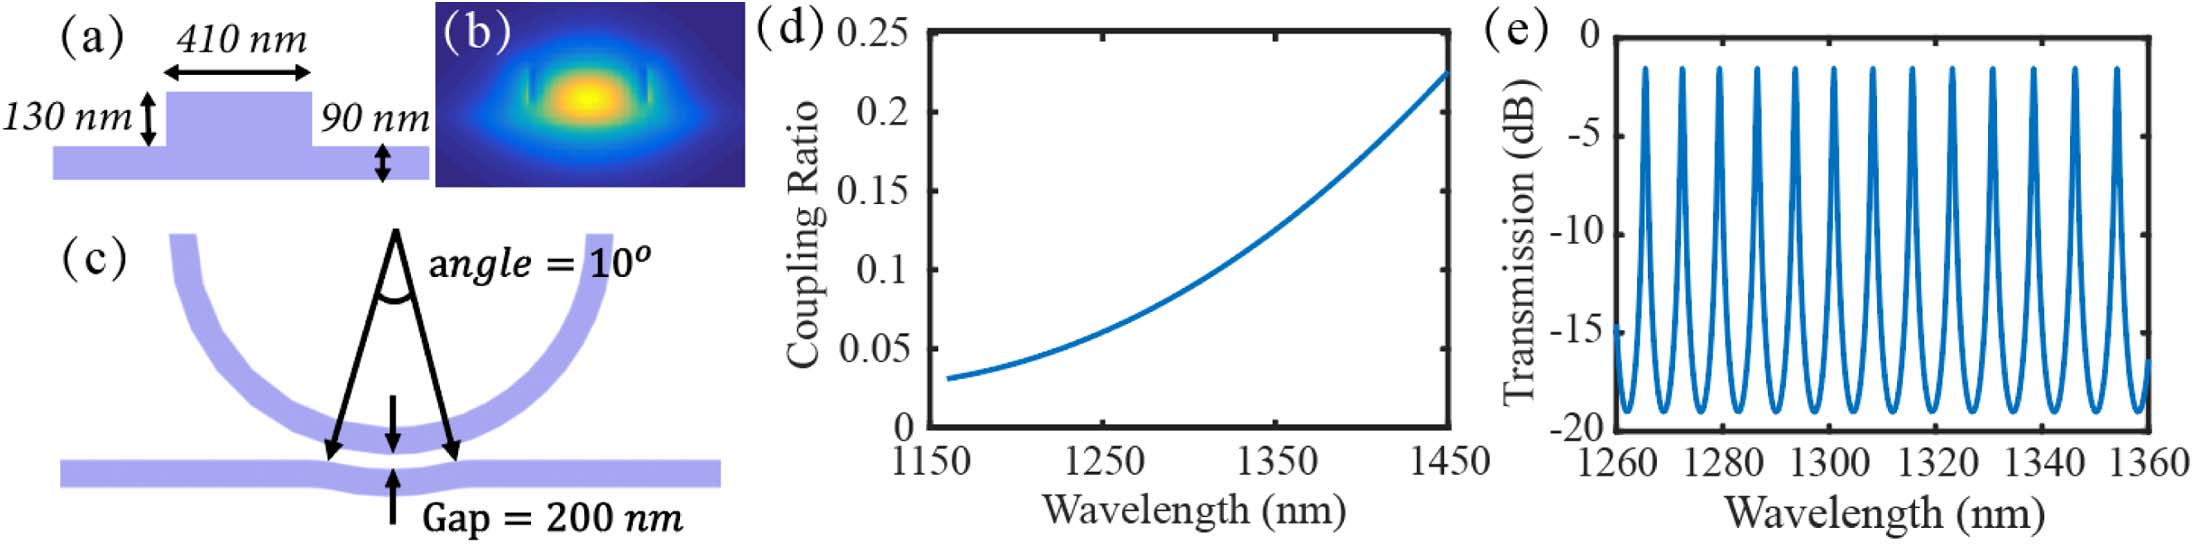
    Fig. 2. (a) Waveguide dimension of the MRR. (b) Mode profile in the shallow etched waveguide. (c) Schematic of the bending-shaped directional coupler used in the MRR. (d) Simulated coupling ratio of the designed directional coupler by 3D FDTD simulation. (e) Calculated transmission spectrum of the designed MRR.
    Simulated transmission spectrum of the 10-channel AWG.
    Fig. 3. Simulated transmission spectrum of the 10-channel AWG.
    (a) Microscope image of the integrated spectrometer with heater-controlled tunable MRR, 10-channel AWG, and integrated germanium photodetector array. (b) Microscope image of the 10-channel AWG. (c) Microscope image of the free propagation region of the AWG, with parabolic tapers designed at the interface of the slab waveguide and the channel waveguides. (d) Microscope image of the MRR with electrical micro-heater fabricated above the waveguide. (e) Microscope image of the on-chip germanium photodetector array.
    Fig. 4. (a) Microscope image of the integrated spectrometer with heater-controlled tunable MRR, 10-channel AWG, and integrated germanium photodetector array. (b) Microscope image of the 10-channel AWG. (c) Microscope image of the free propagation region of the AWG, with parabolic tapers designed at the interface of the slab waveguide and the channel waveguides. (d) Microscope image of the MRR with electrical micro-heater fabricated above the waveguide. (e) Microscope image of the on-chip germanium photodetector array.
    (a) Normalized experimental transmission spectrum of the MRR. (b) Normalized transmission spectrum within one FSR of the MRR. (c) Voltages applied to the micro-heater for wavelength scans. (d) Normalized experimental transmission spectrum of the MRR with 35 resonance wavelength scans across the full FSR. (e) Step-response measurement result of the MRR with electrical micro-heater.
    Fig. 5. (a) Normalized experimental transmission spectrum of the MRR. (b) Normalized transmission spectrum within one FSR of the MRR. (c) Voltages applied to the micro-heater for wavelength scans. (d) Normalized experimental transmission spectrum of the MRR with 35 resonance wavelength scans across the full FSR. (e) Step-response measurement result of the MRR with electrical micro-heater.
    Normalized experimental transmission spectrum of the 10-channel AWG.
    Fig. 6. Normalized experimental transmission spectrum of the 10-channel AWG.
    (a) Unnormalized photocurrents measured from all 10 output channels of secondary-stage AWG without wavelength scans. (b) Unnormalized photocurrents measured from one of the 10 output channels of the AWG with 35 wavelength scans across one AWG channel. (c) Experimental transmission spectrum of the integrated scanning spectrometer with 350 wavelength channels measured by on-chip germanium photodetectors before normalization of the grating coupler spectral response.
    Fig. 7. (a) Unnormalized photocurrents measured from all 10 output channels of secondary-stage AWG without wavelength scans. (b) Unnormalized photocurrents measured from one of the 10 output channels of the AWG with 35 wavelength scans across one AWG channel. (c) Experimental transmission spectrum of the integrated scanning spectrometer with 350 wavelength channels measured by on-chip germanium photodetectors before normalization of the grating coupler spectral response.
    Measurement results of three different spectra formed by two spectral lines spaced by (a) 7 nm, (b) 1 nm, and (c) 0.4 nm by the proposed integrated scanning spectrometer.
    Fig. 8. Measurement results of three different spectra formed by two spectral lines spaced by (a) 7 nm, (b) 1 nm, and (c) 0.4 nm by the proposed integrated scanning spectrometer.
    Experimental demonstration of a B-frame of SD-OCT system. (a) Interference spectrum captured by the proposed scanning spectrometer. (b) A-scan recovered from the measured spectrum. (c) B-frame obtained by scanning the sample across a straight line along the lateral direction.
    Fig. 9. Experimental demonstration of a B-frame of SD-OCT system. (a) Interference spectrum captured by the proposed scanning spectrometer. (b) A-scan recovered from the measured spectrum. (c) B-frame obtained by scanning the sample across a straight line along the lateral direction.
    Zunyue Zhang, Yi Wang, Jiarui Wang, Dan Yi, David Weng U Chan, Wu Yuan, Hon Ki Tsang. Integrated scanning spectrometer with a tunable micro-ring resonator and an arrayed waveguide grating[J]. Photonics Research, 2022, 10(5): A74
    Download Citation