
Kun Liu, Changhe Zhou, Shaoqing Wang, Shengbin Wei, Xin Fan. 3D shape measurement of a ground surface optical element using band-pass random patterns projection[J]. Chinese Optics Letters, 2015, 13(8): 081101
- Chinese Optics Letters
- Vol. 13, Issue 8, 081101 (2015)
Abstract
An optical glass aspheric lens is usually made by grinding and polishing. They can be made by point-contact contouring to roughly modify the right area which is then polished to its final shape. During the manufacturing process, there is concern about the 3D shape of the semi-finished components for the next production[
A white light interferometer is a noncontact optical method for surface-height measurement of 3D structures with surface profiles varying between tens of nanometers and a few centimeters[
In this work, we develop a noncontact active binocular 3D scanner[
Sign up for Chinese Optics Letters TOC. Get the latest issue of Chinese Optics Letters delivered right to you!Sign up now
Figure
![]()
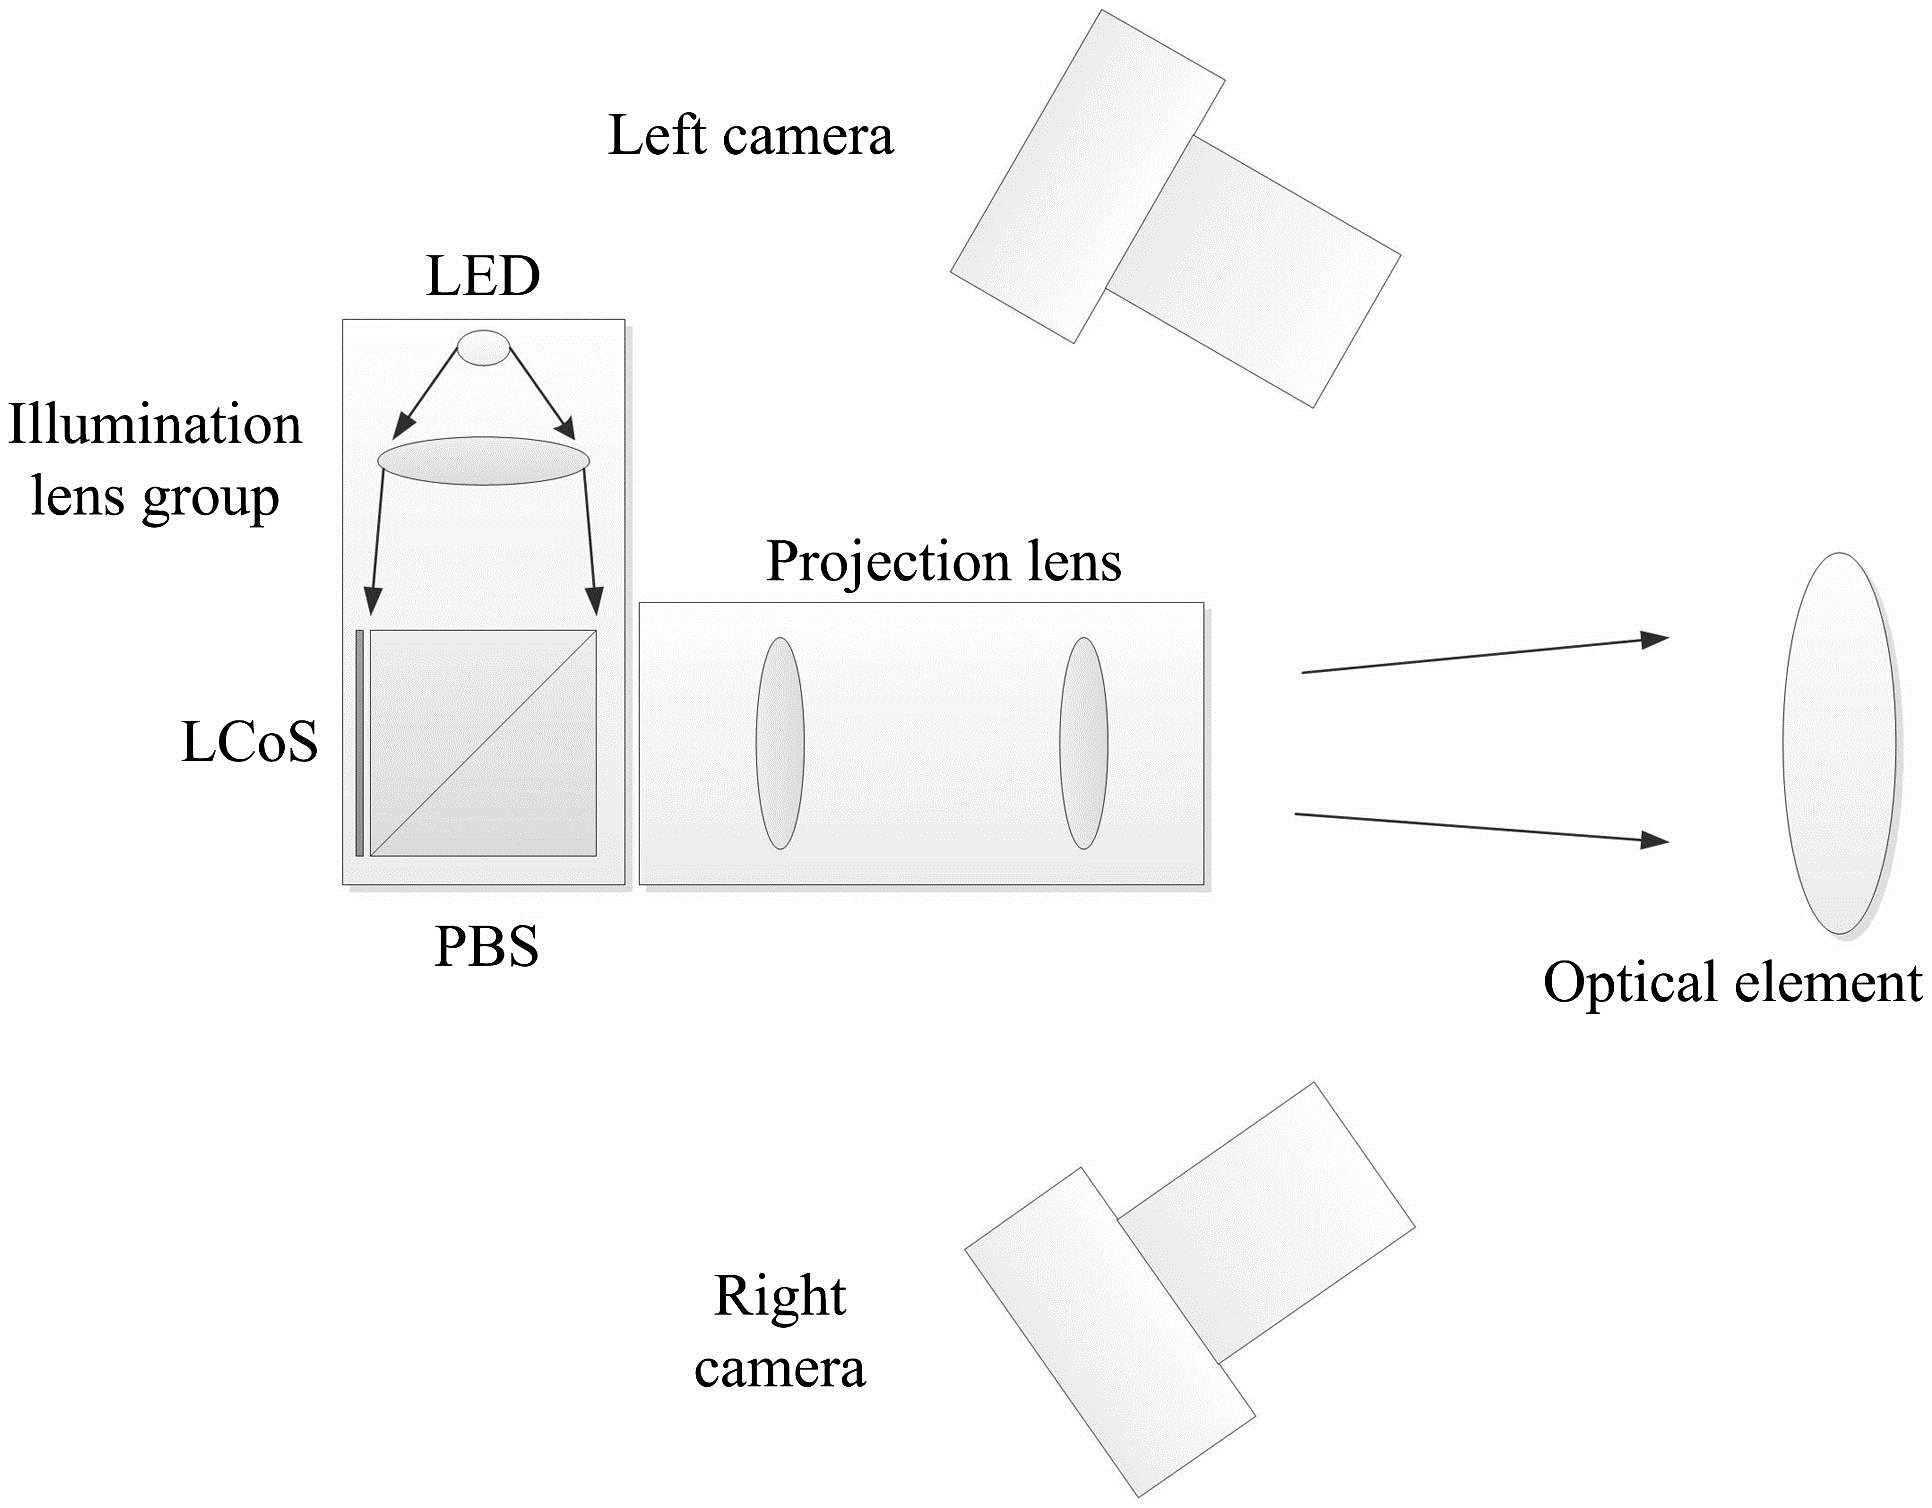
Figure 1.Schematic view of the active binocular 3D measurement system.
The camera:projector pixel ratio is defined as 1 camera pixel over the number of projector pixels it can see. It is often the case that a single camera pixel corresponds to a linear combination of two or more adjacent projector pixels. This is known as having a low camera-projector pixel ratio. The Gray code method degrades in accordance with the pixel ratio, as insignificant bits become too blurred to be recovered and are simply discarded[
As shown in Fig.
In our setup, the pixel level lateral resolution is 0.4 mm and longitudinal resolution is about 0.8 mm. It is obvious that longitudinal resolution can be enhanced by replacing the lens with a longer focal length. The resolution can also be improved by sub-pixel interpolation[
![]()
Figure 2.Rectified stereo configuration of the binocular 3D measurement system.
The surface of the optical element under test is rough and translucent. When using a laser line to scan the optical element, because of scattering, clear images cannot be obtained. Wiegmann
The process of finding homologous points from the left and right camera images can be seen as template matching. Traditional template matching methods, sum of absolute intensity value differences (SADs), or normalized cross correlation (NCC), simply perform template matching in the spatial domain. However, with the areal correlation technique, deformation caused by the different camera angle leads to many false matches and poor 3D reconstruction precision. In view of the existing situation, it is found that this problem can be solved by reducing the size of the correlation windows to 1 pixel in the spatial domain and extending the length of the correlation windows to
![]()
Figure 3.Corresponding pixels with similar gray-value vectors using temporal correlation.
![]()
Figure 4.Binarized image of the object to be measured.
Left–right pixel correspondence can be directly established and triangulated to reconstruct scene depths. Since it tolerates uniform brightness variations as well, zero mean normalized cross-correlation-based matching is one of the most popular similarity measurement algorithms. For the TCT-based stereo matching problem, it is given by
The numerator of Eq. (
Consequently, a series of 15 binary band-pass random patterns will be used to encode the surface of the object. Once a pattern is projected to the object, two cameras capture the image at the same time. After capturing, 15 pairs of stereo images will be obtained. Then, rectification will be performed to ensure that the epipolar line for a point is simply the line that has the same row coordinate as the point[
![]()
Figure 5.3D point cloud of the target object.
In conclusion, we develop a noncontact active 3D scanner to measure the 3D profile of a rough surface glass optical element. Two cameras simultaneously capture the band-pass binary random patterns which are projected on the target object. The highlight of this system is using the TCT to determine the stereo correspondence between the pixels of the two cameras. The 3D point cloud can be reconstructed by the triangulation principle. This scanner can measure a rough surface glass lens with sufficient accuracy, which should be a useful optical apparatus for practical applications.
References
[1] L. Li, Z. Wang, F. Pei, X. Wang. Chin. Opt. Lett., 11, S21102(2013).
[2] P. de Groot, L. Deck. Opt. Lett., 18, 1462(1993).
[3] F. Chen, G. M. Brown, M. Song. Opt. Eng., 39, 10(2000).
[4] Z. Zhao, J. Wu, Y. Su, N. Liang, H. Duan. Chin. Opt. Lett., 12, 091101(2014).
[5] X. Yu, Y. Ho, L. Tan, H. Huang, H. Kwok. J. Disp. Technol., 3, 295(2007).
[6] V. Couture, N. Martin, S. Roy. Int. J. Comp. Vis., 108, 204(2014).
[7] Y. Fu, J. Yang, Z. Wang, H. Wu. Chin. Opt. Lett., 12, 121101(2014).
[8] A. Wiegmann, H. Wagner, R. Kowarschik. Opt. Express, 14, 7692(2006).
[9] M. Schaffer, M. Grosse, R. Kowarschik. Appl. Opt., 49, 3622(2010).
[10] J. Davis, R. Ramamoorthi, S. Rusinkiewicz. IEEE Comp. Soc. Conf. Comp. Vis. Pattern Recognit., 2, 359(2003).
[11] A. Fusiello, E. Trucco, A. Verri. Mach. Vis. Appl., 12, 16(2000).
[12] K. Liu, C. Zhou, S. Wei, S. Wang, X. Fan, J. Ma. Appl. Opt., 53, 6083(2014).

Set citation alerts for the article
Please enter your email address
© Copyright 2018-2021 | Chinese Laser Press. All Rights Reserved 沪ICP备15018463号-20