
Zishuo Han, Chunping Wang, Qiang Fu, Bin Zhao. Remote Sensing Image Mode Translation by Spatial Disentangled Representation Based GAN[J]. Acta Optica Sinica, 2021, 41(7): 0728003
- Acta Optica Sinica
- Vol. 41, Issue 7, 0728003 (2021)
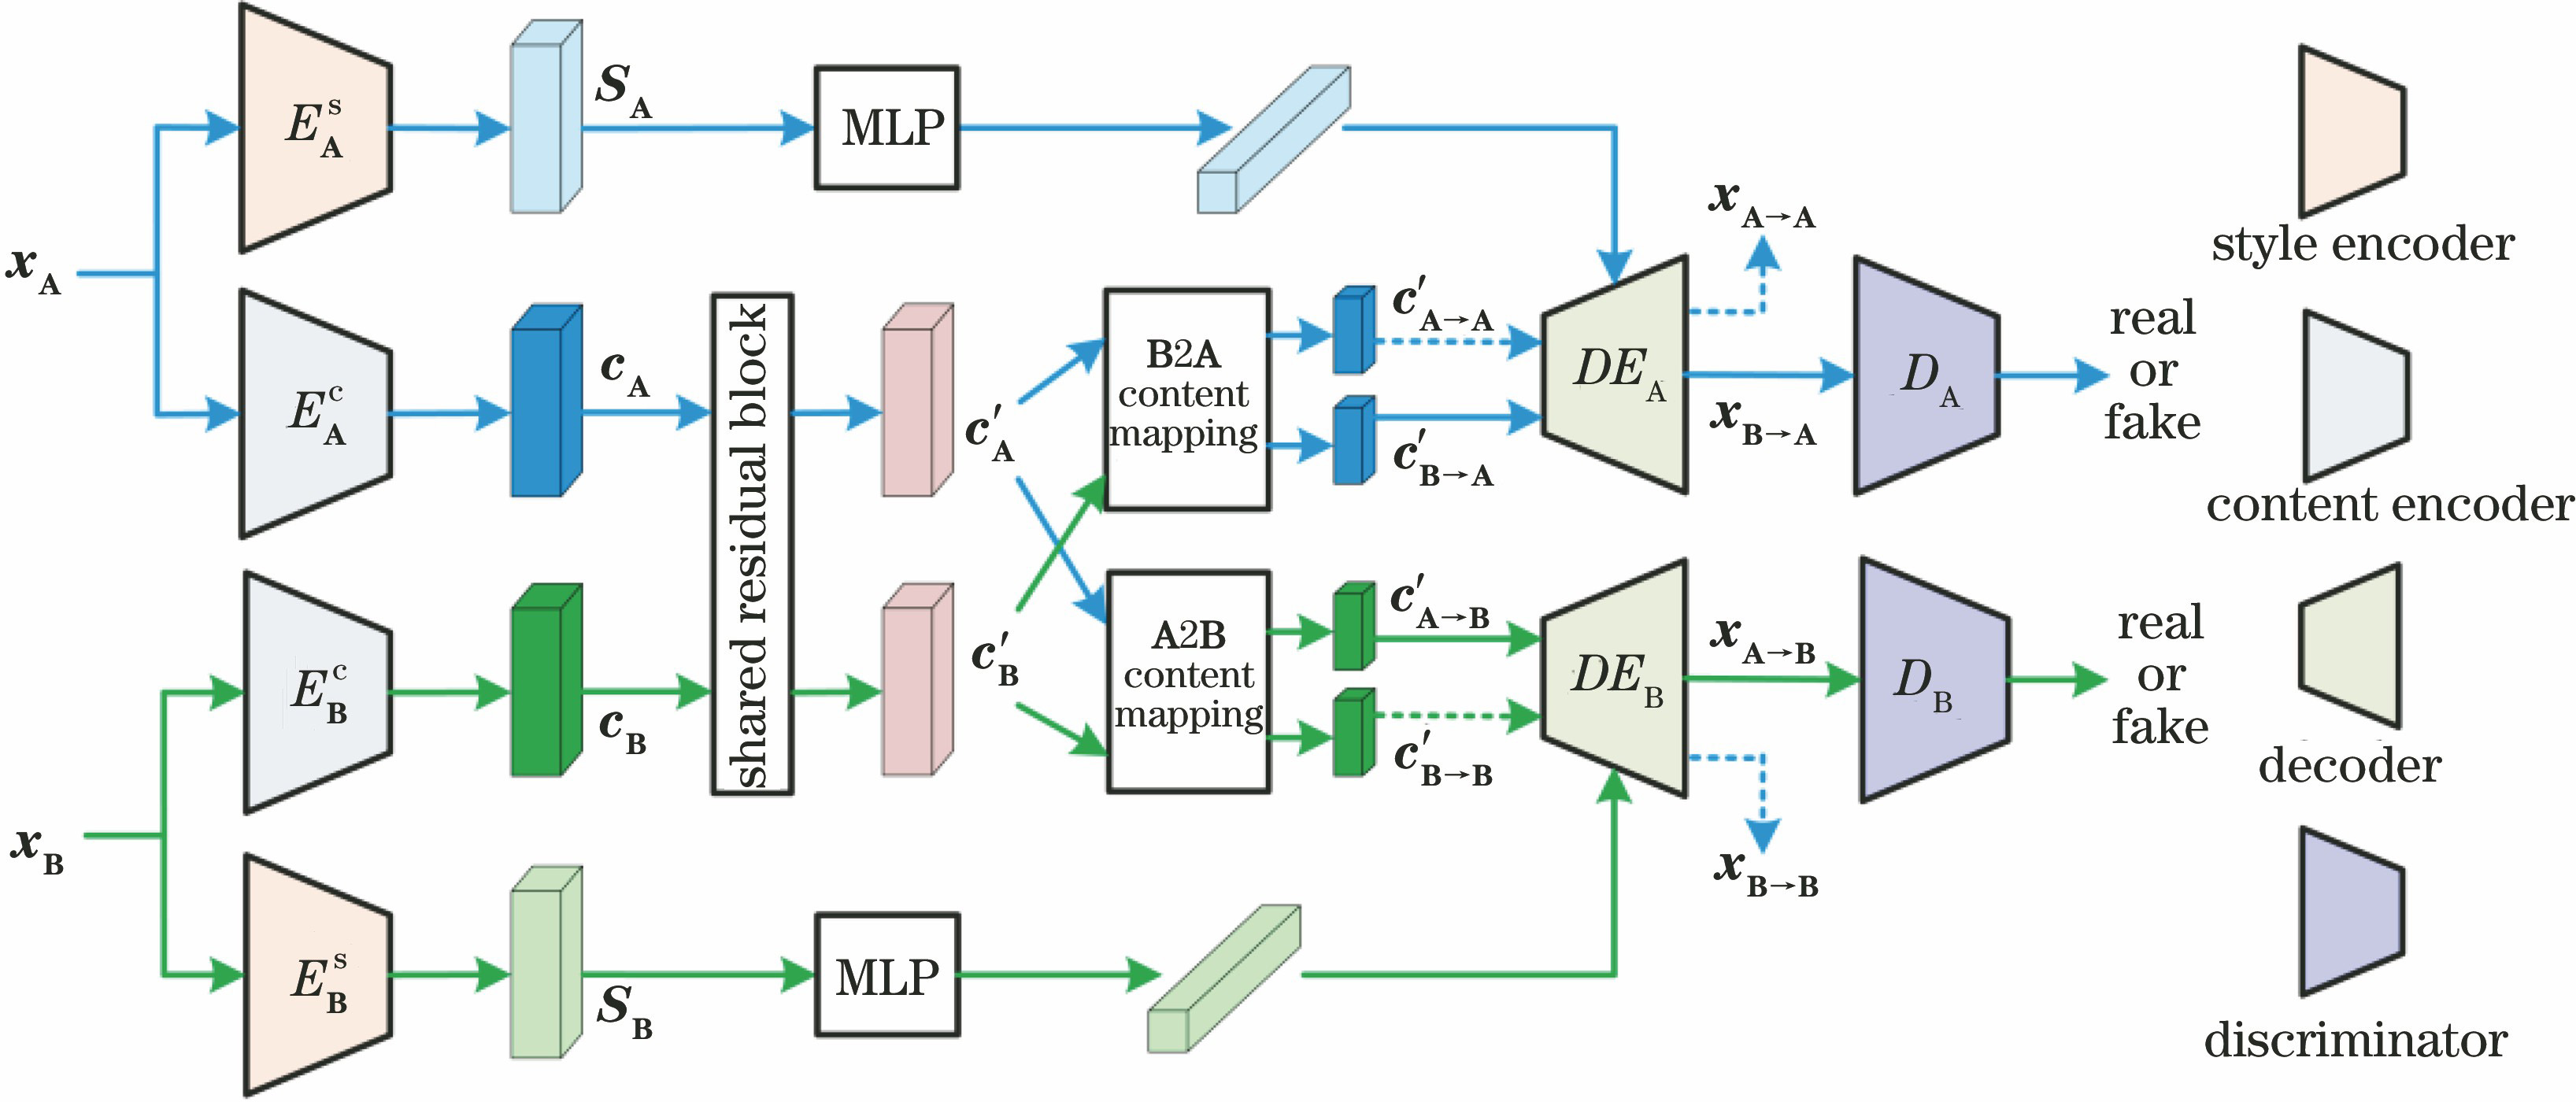
Fig. 1. Basic framework of SDR-CycleGAN
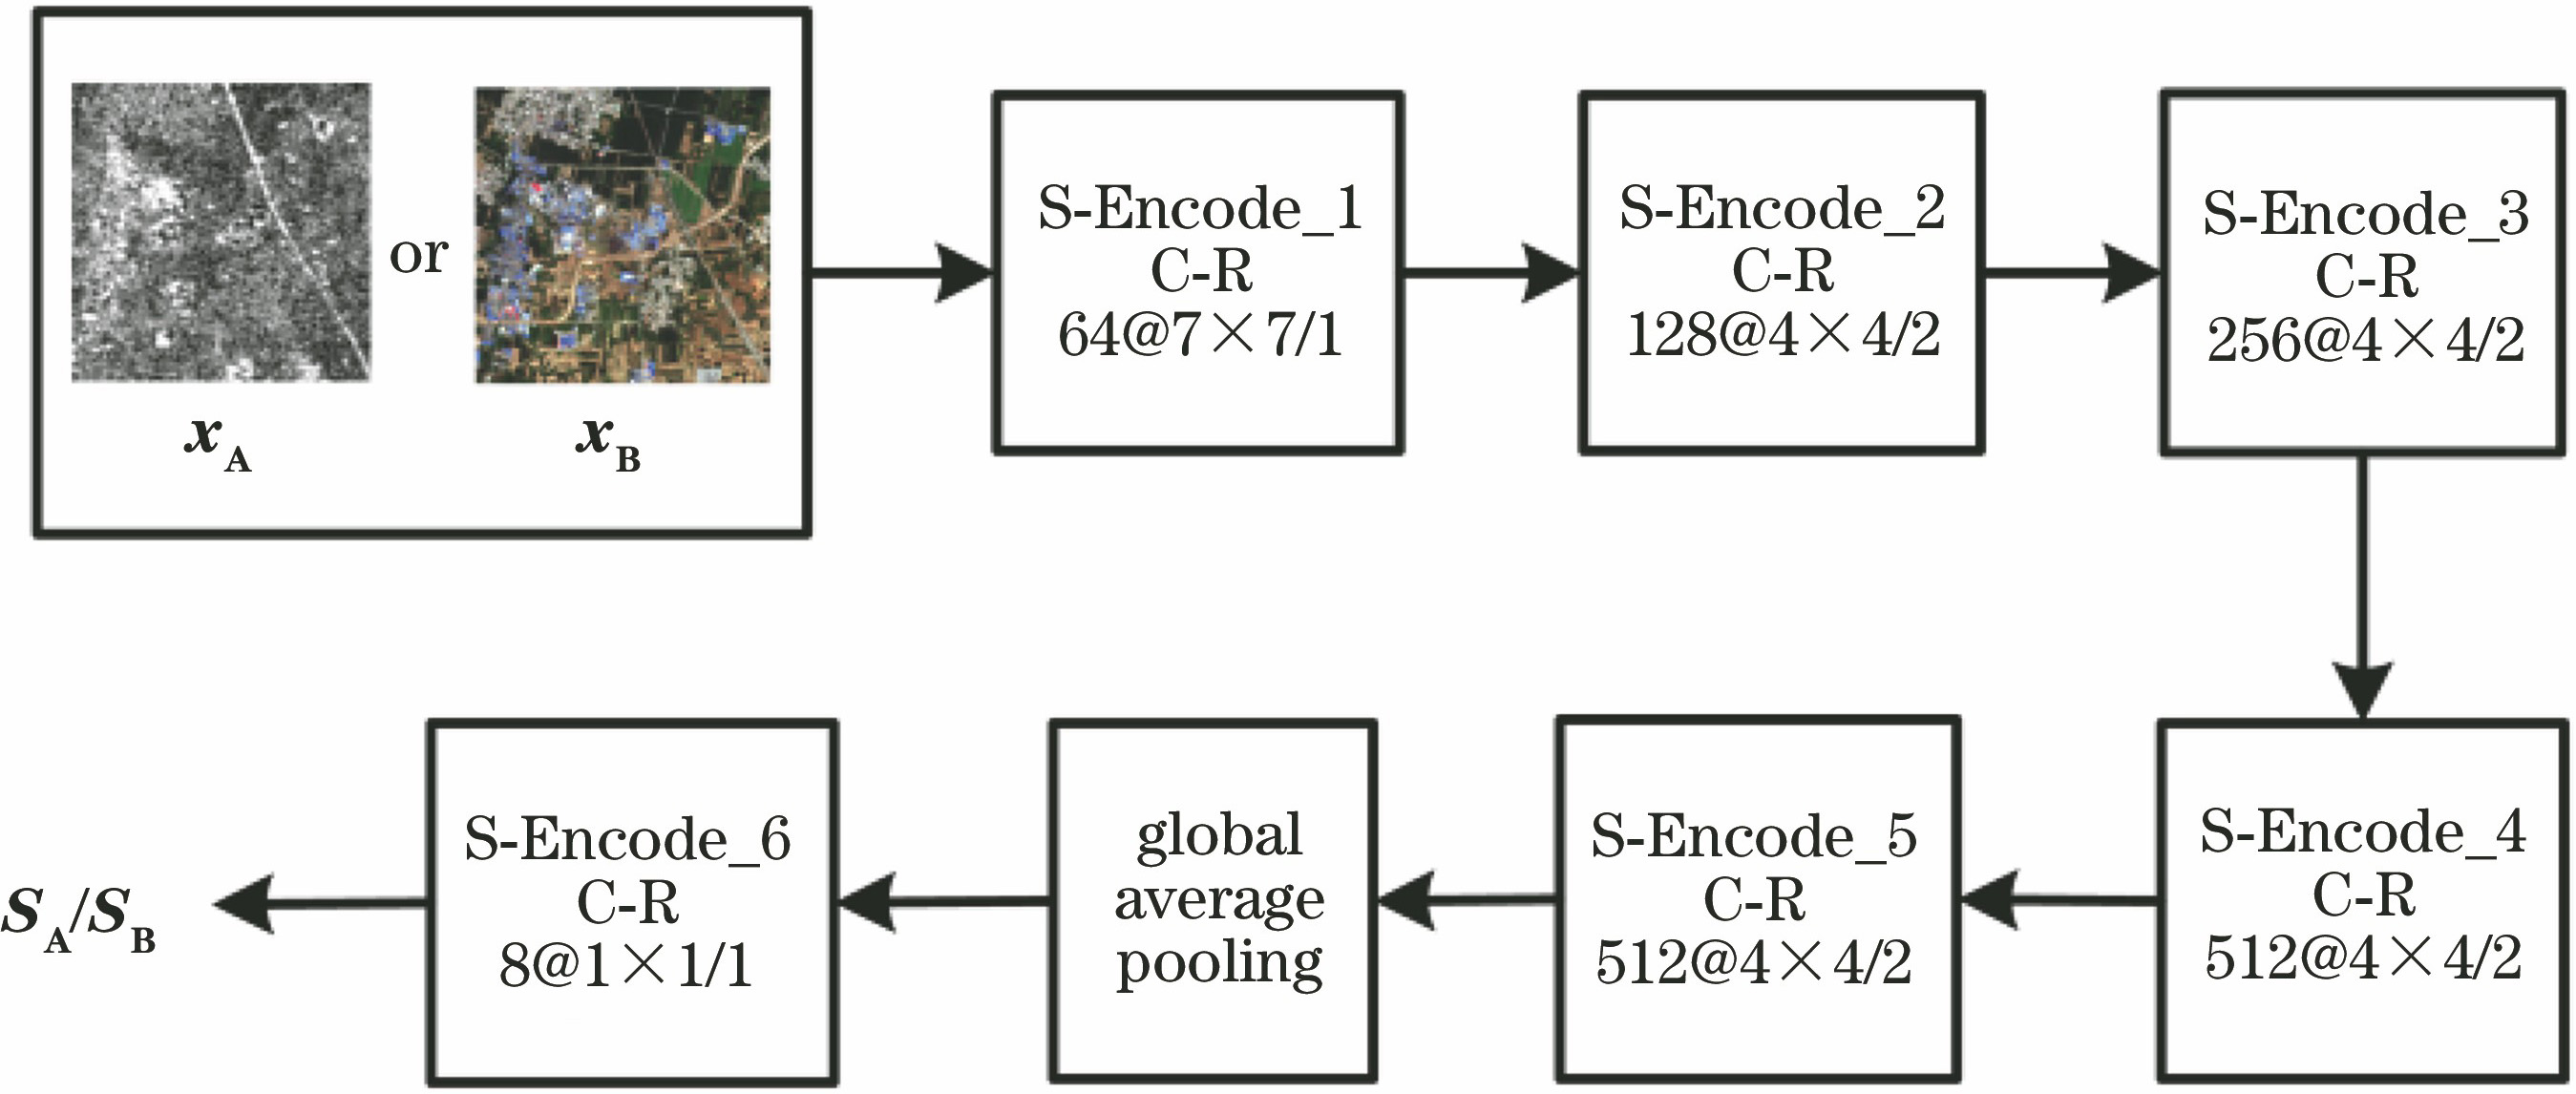
Fig. 2. Network structure of style encoder
Fig. 3. Network structure of content encoder
Fig. 4. Network structure of content domain translation module
Fig. 5. Network structure of decoder
Fig. 6. Network structure of discriminator
Fig. 7. Working process diagram of discriminator
Fig. 8. Samples of SEN1-2 dataset
Fig. 9. Samples of SARptical dataset
Fig. 10. Samples of WHU-SEN-City dataset. (a) SAR image; (b) ORS image
Fig. 11. Image blocks of WHU-SEN-City dataset
Fig. 12. Schematic diagram of image cutting. (a) Example of scene image; (b) image blocks
Fig. 13. Examples of SAR image to ORS image translation on SEN1-2 dataset
Fig. 14. Examples of ORS image to SAR image translation on SEN1-2 dataset
Fig. 15. Examples of SAR image to ORS image translation on SARptical dataset
Fig. 16. Examples of ORS image to SAR image translation on SARptical dataset
Fig. 17. Examples of SAR image to ORS image translation on WHU-SEN-City dataset. (a) SAR images; (b) ORS images; (c) BRIT translation results; (d) CR-CycleGAN translation results; (e) MUNIT translation results; (f) S-CycleGAN translation results; (g) DSMAP translation results; (h) SDR-CycleGAN translation results
Fig. 18. Examples of ORS image to SAR image translation on WHU-SEN-City dataset. (a) SAR images; (b) ORS images; (c) BRIT translation results; (d) CR-CycleGAN translation results; (e) S-CycleGAN translation results; (f) MUNIT translation results; (g) DSMAP translation results; (h) SDR-CycleGAN translation results
|
Table 1. Quality assessments of SAR image to ORS image translation on SEN1-2 dataset
|
Table 2. Quality assessments of ORS image to SAR image translation on SEN1-2 dataset
|
Table 3. Quality assessments of SAR image to ORS image translation on SARptical dataset
|
Table 4. Quality assessments of ORS image to SAR image translation on SARptical dataset
|
Table 5. Quality assessment of SAR image to ORS image translation on WHU-SEN-City dataset
|
Table 6. Quality assessment of ORS image to SAR image translation on WHU-SEN-City dataset

Set citation alerts for the article
Please enter your email address
© Copyright 2018-2021 | Chinese Laser Press. All Rights Reserved 沪ICP备15018463号-20