• Acta Optica Sinica
  • Vol. 38, Issue 5, 0528002 (2018)
Bo Zhang1、2, Yu Zhou、*, Jianfeng Sun1, Guo Zhang1、2, Guangyuan Li1、2, Mengmeng Xu1、2, Hongyu He1、2, and Chenzhe Lao1、2
Author Affiliations
  • 1 Key Laboratory of Space Laser Communication and Detection Technology, Shanghai Institute of Optics and Fine Mechanics, Chinese Academy of Sciences, Shanghai 201800, China
  • 2 University of Chinese Academy of Sciences, Beijing 100049, China
  • show less
    DOI: 10.3788/AOS201838.0528002 Cite this Article Set citation alerts
    Bo Zhang, Yu Zhou, Jianfeng Sun, Guo Zhang, Guangyuan Li, Mengmeng Xu, Hongyu He, Chenzhe Lao. Optimization Research on Multi-Channel Wide-Swath Synthetic Aperture Imaging Ladar Transceiver System[J]. Acta Optica Sinica, 2018, 38(5): 0528002 Copy Citation Text show less
    Structural diagram of the multi-channel wide-swath SAIL transceiver system
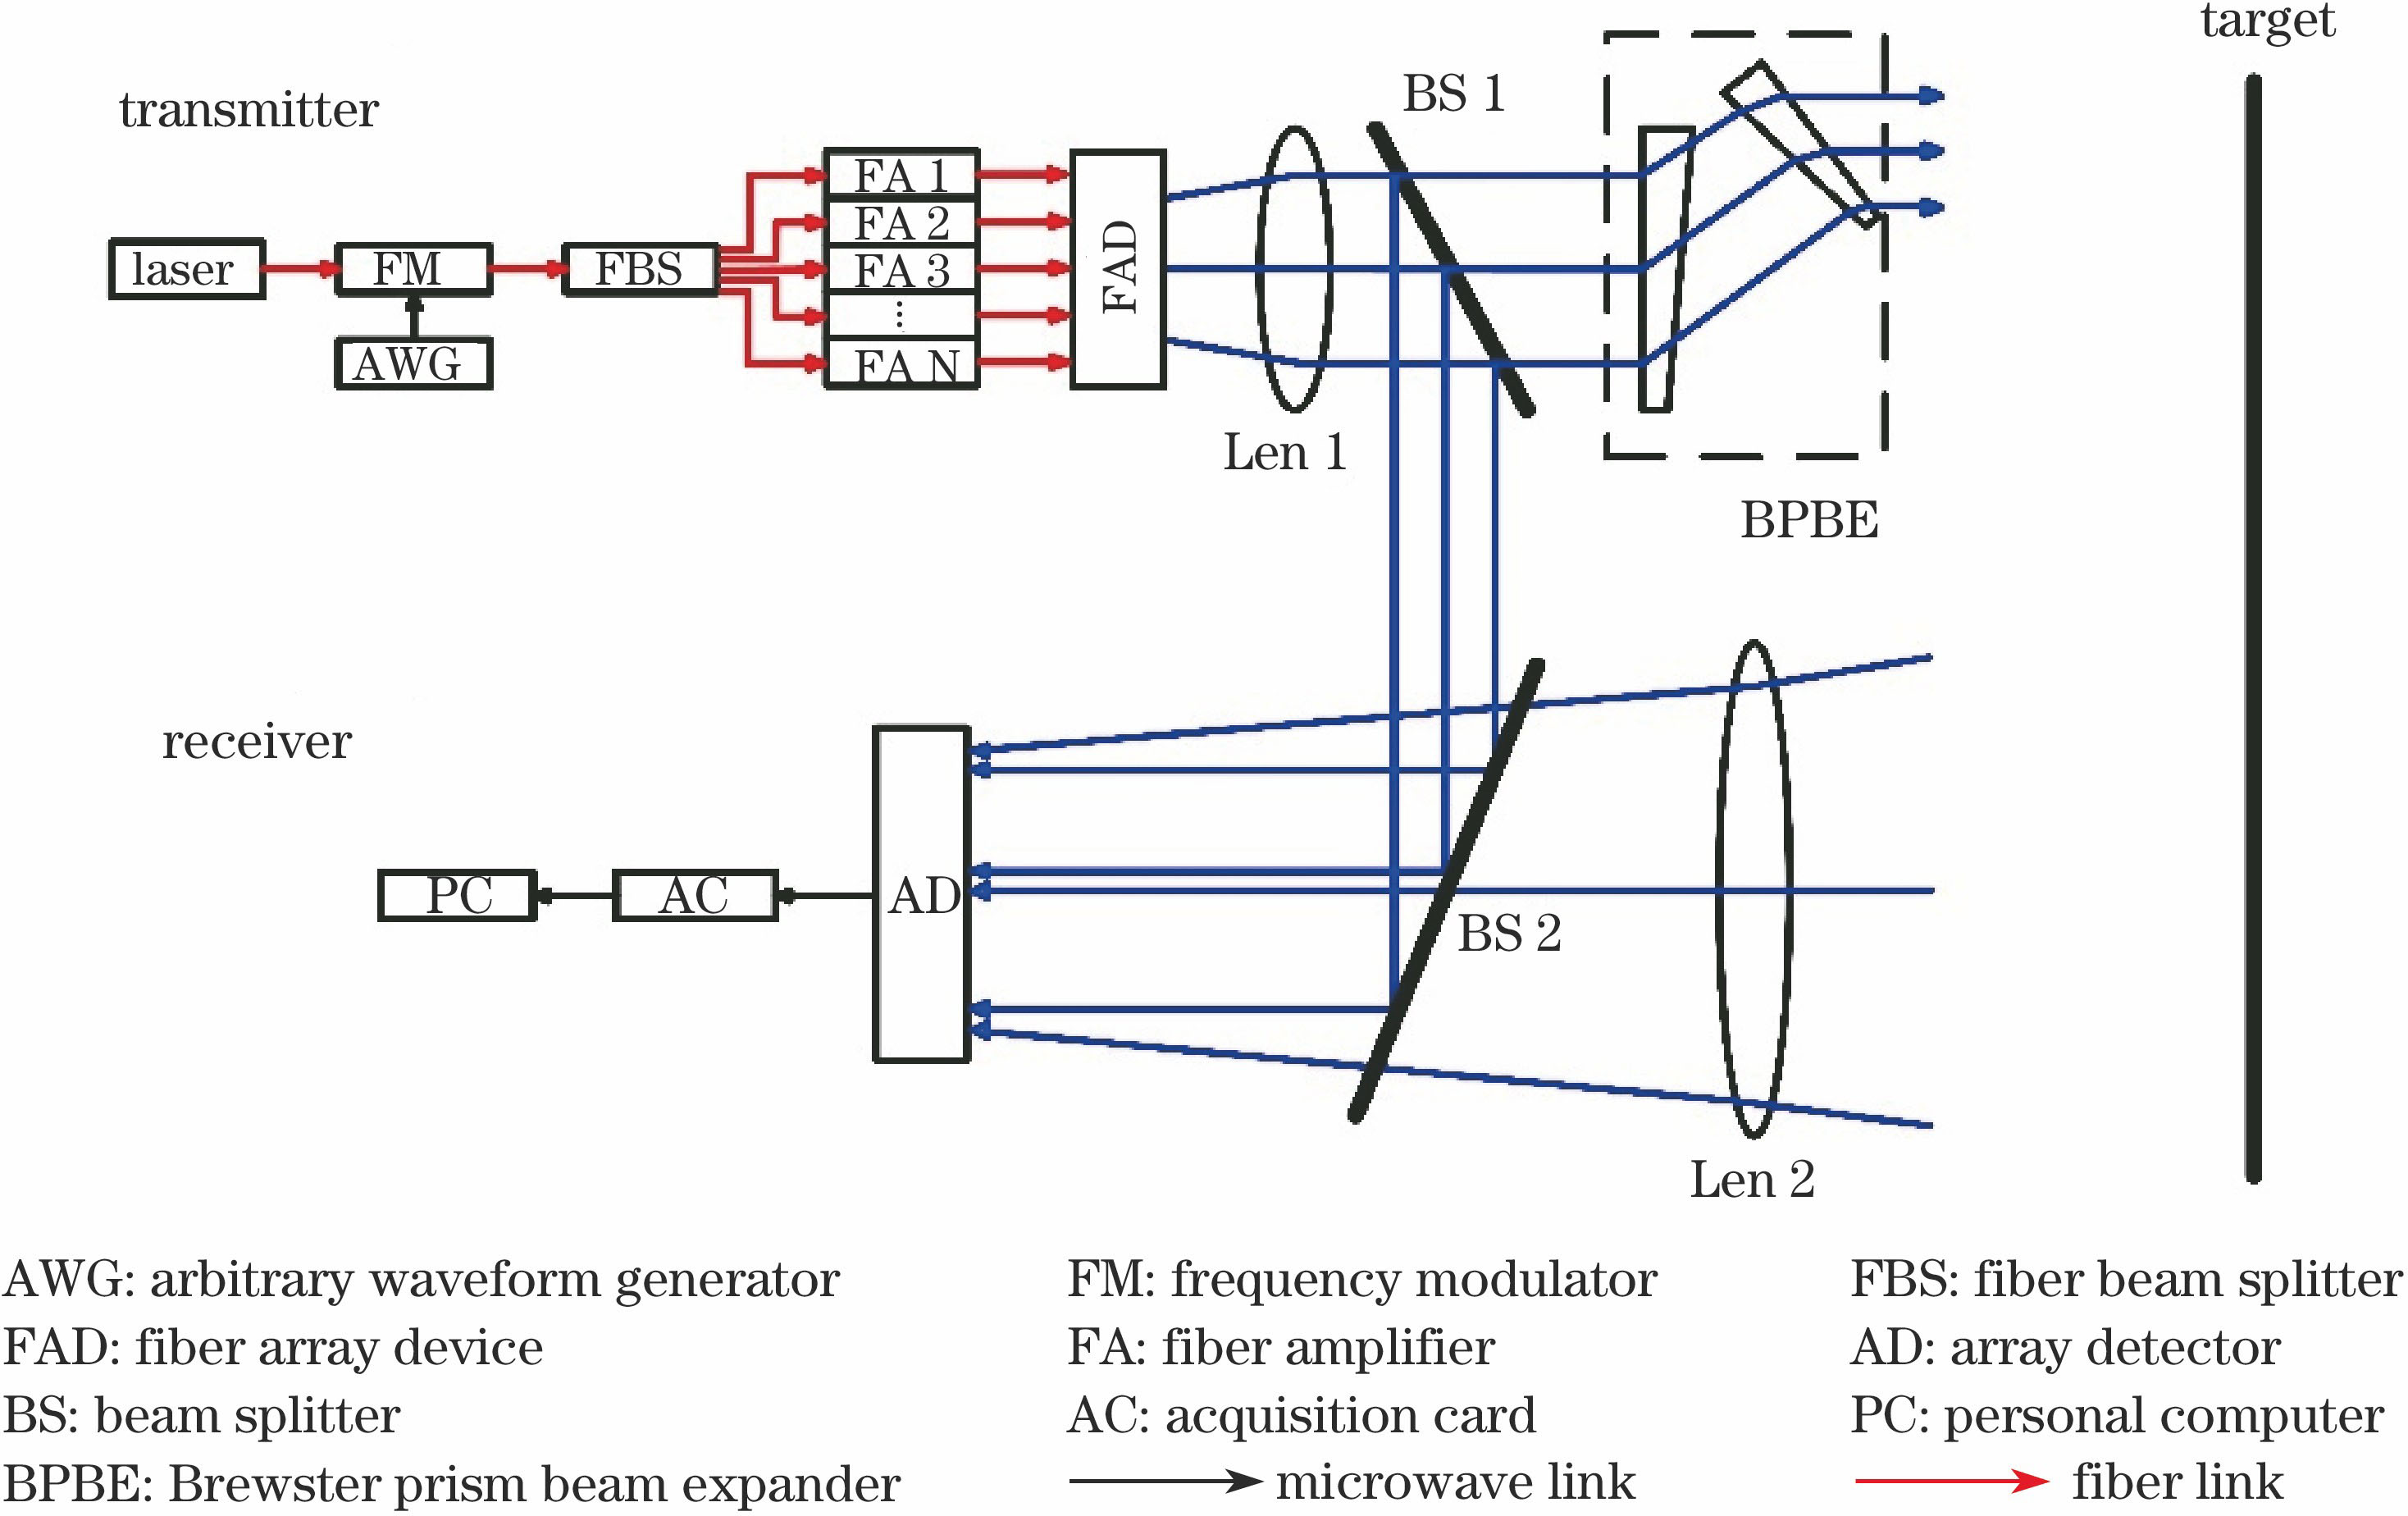
    Fig. 1. Structural diagram of the multi-channel wide-swath SAIL transceiver system
    Vertical layout schematic of the fibers in the fiber array device. (a) Emission fiber; (b) far-field imaging; (c) far-field strip imaging
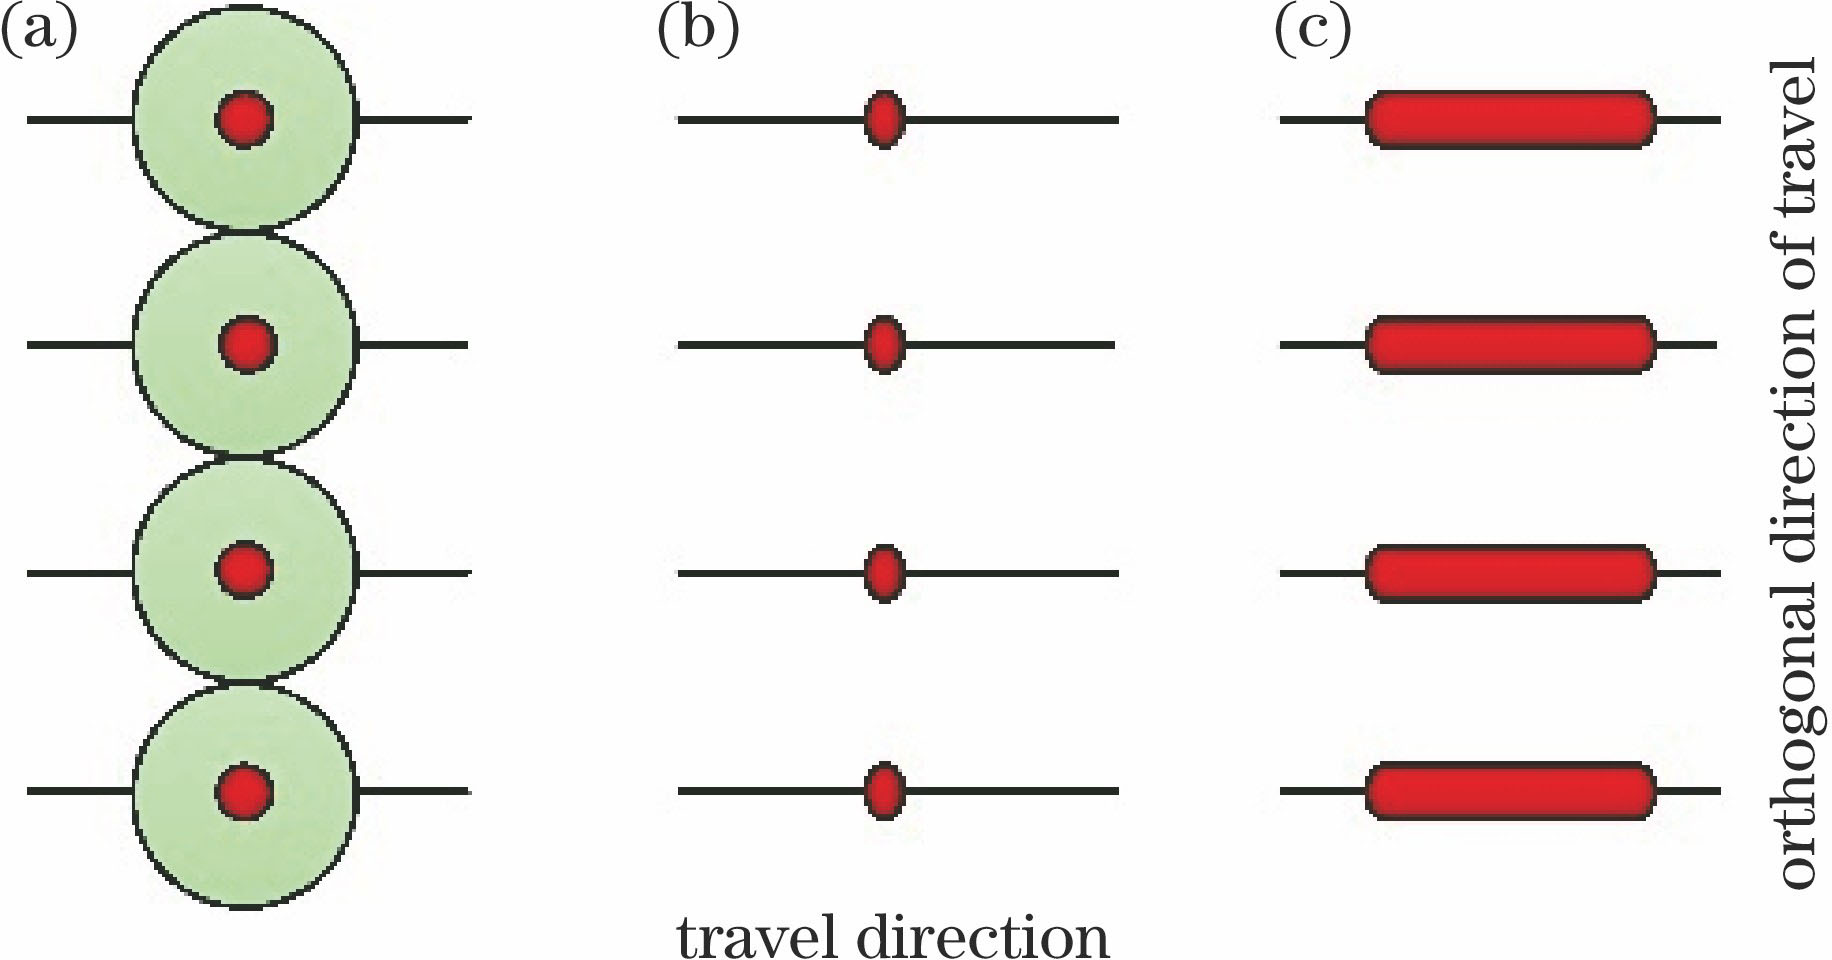
    Fig. 2. Vertical layout schematic of the fibers in the fiber array device. (a) Emission fiber; (b) far-field imaging; (c) far-field strip imaging
    Tilt layout schematic of the fibers in the fiber array device. (a) Emission fiber; (b) far-field imaging; (c) far-field projection in the orthogonal direction of travel; (d) far-field strip imaging
    Fig. 3. Tilt layout schematic of the fibers in the fiber array device. (a) Emission fiber; (b) far-field imaging; (c) far-field projection in the orthogonal direction of travel; (d) far-field strip imaging
    Layout model of the fibers in the fiber array device
    Fig. 4. Layout model of the fibers in the fiber array device
    Optimal algorithmic flow chart of the fiber layout model in the fiber array device
    Fig. 5. Optimal algorithmic flow chart of the fiber layout model in the fiber array device
    Comparison of (a) optimal and (b) tilted fiber layout when n=12
    Fig. 6. Comparison of (a) optimal and (b) tilted fiber layout when n=12
    Comparison of (a) optimal and (b) tilted fiber layout when n=16
    Fig. 7. Comparison of (a) optimal and (b) tilted fiber layout when n=16
    Curve of the optimization factor
    Fig. 8. Curve of the optimization factor
    Schematic of the array element layout in array detectors
    Fig. 9. Schematic of the array element layout in array detectors
    Number of fibersLa-afterLa-beforeβ /%
    1125.0125.00
    2250.0250.00
    3248.7249.50.31
    4371.4374.20.76
    5492.2499.01.35
    6610.7623.72.10
    7726.1748.52.99
    8837.8873.24.05
    9945.2997.95.29
    101047.41122.76.71
    111434.41247.78.34
    121232.21372.210.20
    131312.31496.912.34
    141381.61621.714.80
    151437.11746.417.71
    161506.31871.219.50
    Table 1. Comparison of La value between pre-optimization and post-optimization
    Bo Zhang, Yu Zhou, Jianfeng Sun, Guo Zhang, Guangyuan Li, Mengmeng Xu, Hongyu He, Chenzhe Lao. Optimization Research on Multi-Channel Wide-Swath Synthetic Aperture Imaging Ladar Transceiver System[J]. Acta Optica Sinica, 2018, 38(5): 0528002
    Download Citation