• Chinese Optics Letters
  • Vol. 16, Issue 5, 050008 (2018)
Shang Sun, Chen Zhang, Haitao Zhang, Yisheng Gao, Ningbo Yi, Qinghai Song*, and Shumin Xiao**
Author Affiliations
  • State Key Laboratory of Tunable Laser Technology, Ministry of Industry and Information Technology, Key Laboratory of Micro-Nano Optoelectronic Information System, Shenzhen Graduate School, Harbin Institute of Technology, Shenzhen 518055, China
  • show less
    DOI: 10.3788/COL201816.050008 Cite this Article Set citation alerts
    Shang Sun, Chen Zhang, Haitao Zhang, Yisheng Gao, Ningbo Yi, Qinghai Song, Shumin Xiao. Enhancing magnetic dipole emission with magnetic metamaterials[J]. Chinese Optics Letters, 2018, 16(5): 050008 Copy Citation Text show less
    (a) Schematic picture of the hybrid plasmonic system with Ag nanostrip arrays and Ag film sandwiched by an Eu3+:PMMA layer. (b) The scanning electron microscope (SEM) image of the nanostrip structure before being coated with the Eu3+:PMMA layer. (c) Emission spectrum for Eu3+:PMMA film recorded under 385 nm excitation. (d) Experimentally measured (red line) and numerically calculated (black line) linear reflection spectra of the sample for TM polarizations. (e) The distribution of the magnetic field enhancement factor |H/H0| at 595 nm. (f) The distribution of the magnetic field enhancement factor |H/H0| at 545 nm. (g) The distribution of the electric field enhancement factor |E/E0| at 610 nm.
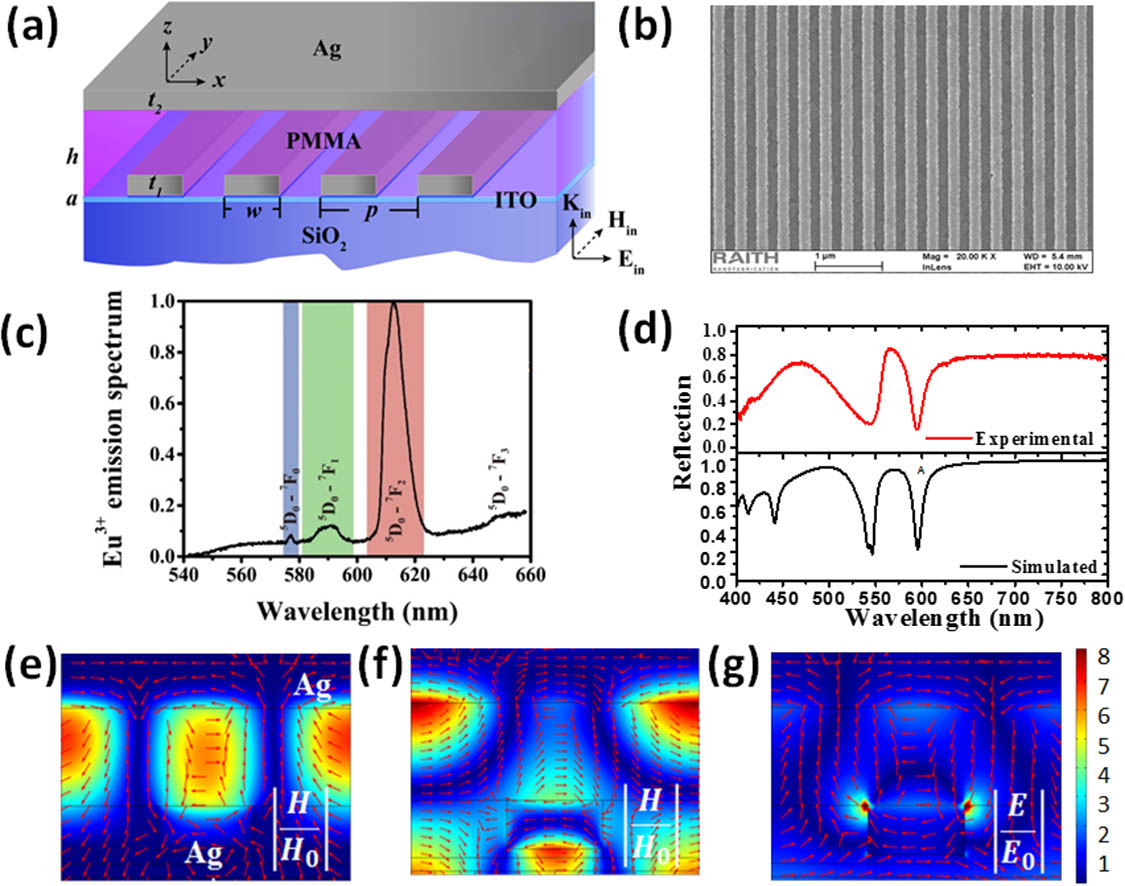
    Fig. 1. (a) Schematic picture of the hybrid plasmonic system with Ag nanostrip arrays and Ag film sandwiched by an Eu3+:PMMA layer. (b) The scanning electron microscope (SEM) image of the nanostrip structure before being coated with the Eu3+:PMMA layer. (c) Emission spectrum for Eu3+:PMMA film recorded under 385 nm excitation. (d) Experimentally measured (red line) and numerically calculated (black line) linear reflection spectra of the sample for TM polarizations. (e) The distribution of the magnetic field enhancement factor |H/H0| at 595 nm. (f) The distribution of the magnetic field enhancement factor |H/H0| at 545 nm. (g) The distribution of the electric field enhancement factor |E/E0| at 610 nm.
    Enhancement factor for power transferred into the far field from an MD emitter and an ED emitter placed in the center of the hybrid system. The result is averaged over all possible orientations of the emitter and normalized to the power emitted in vacuum. We observed large enhancement of more than 1 order of magnitude at the resonance for the MD emitter centered around 595 nm.
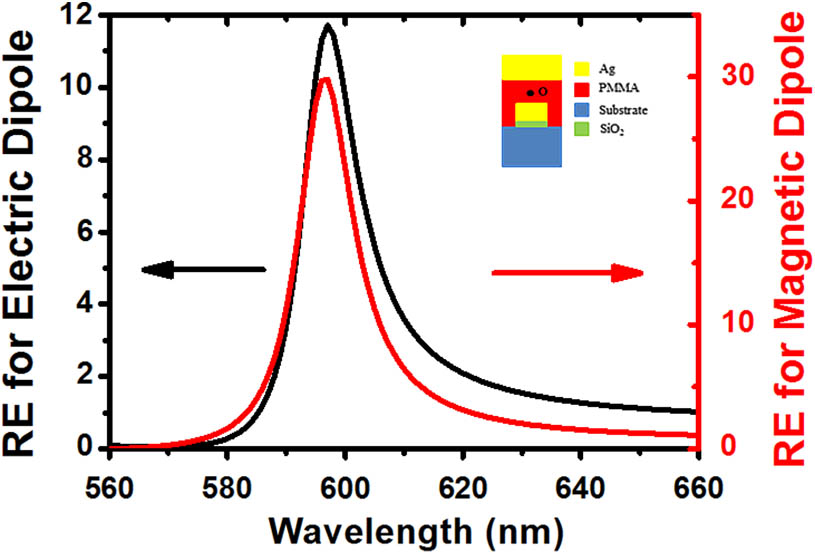
    Fig. 2. Enhancement factor for power transferred into the far field from an MD emitter and an ED emitter placed in the center of the hybrid system. The result is averaged over all possible orientations of the emitter and normalized to the power emitted in vacuum. We observed large enhancement of more than 1 order of magnitude at the resonance for the MD emitter centered around 595 nm.
    Emission spectra of the Eu3+ ions embedded in the hybrid nanostructure with TM and TE polarizations (blue and purple lines), the 55 nm thick Ag film with TM and TE polarizations (black and red lines), and the bare glass substrate with TM and TE polarizations (green and cyan lines). The spectra are normalized to the maximum of the ED emission at 610 nm of the Eu3+ embedded in the hybrid nanostructure.
    Fig. 3. Emission spectra of the Eu3+ ions embedded in the hybrid nanostructure with TM and TE polarizations (blue and purple lines), the 55 nm thick Ag film with TM and TE polarizations (black and red lines), and the bare glass substrate with TM and TE polarizations (green and cyan lines). The spectra are normalized to the maximum of the ED emission at 610 nm of the Eu3+ embedded in the hybrid nanostructure.
    (a) The fitting spectra for MD emission with TE polarization with 0° to TM polarization with 90°. (b) The PL emission intensity for MD emission via the polarization. The PL intensity is integrated following the equation IMDθ=∫583603I(λ)θ dλ. (c) The enhanced PL spectra of the Eu3+ ions embedded inside the hybrid structure with magnetic LDOS with TM polarization in the red line. For comparison, the PL spectrum from Eu3+:PMMA with the same polarization is also shown with the black line, enlarged 10 times for clarity. The net PL enhancement was evaluated by normalizing the excitation power incident into the structure.
    Fig. 4. (a) The fitting spectra for MD emission with TE polarization with 0° to TM polarization with 90°. (b) The PL emission intensity for MD emission via the polarization. The PL intensity is integrated following the equation IMDθ=583603I(λ)θdλ. (c) The enhanced PL spectra of the Eu3+ ions embedded inside the hybrid structure with magnetic LDOS with TM polarization in the red line. For comparison, the PL spectrum from Eu3+:PMMA with the same polarization is also shown with the black line, enlarged 10 times for clarity. The net PL enhancement was evaluated by normalizing the excitation power incident into the structure.
    Shang Sun, Chen Zhang, Haitao Zhang, Yisheng Gao, Ningbo Yi, Qinghai Song, Shumin Xiao. Enhancing magnetic dipole emission with magnetic metamaterials[J]. Chinese Optics Letters, 2018, 16(5): 050008
    Download Citation