Phase-sensitive optical time-domain reflectometry (Φ-OTDR) has attracted numerous attention due to its superior performance in detecting the weak perturbations along the fiber. Relying on the ultra-sensitivity of light phase to the tiny deformation of optical fiber, Φ-OTDR has been treated as a powerful technique with a wide range of applications. It is fundamental to extract the phase of scattering light wave accurately and the methods include coherent detection, I/Q demodulation, 3 by 3 coupler, dual probe pulses, and so on. Meanwhile, researchers have also made great efforts to improve the performance of Φ-OTDR. The frequency response range, the measurement accuracy, the sensing distance, the spatial resolution, and the accuracy of event discrimination, all have been enhanced by various techniques. Furthermore, lots of researches on the applications in various kinds of fields have been carried out, where certain modifications and techniques have been developed. Therefore, Φ-OTDR remains as a booming technique in both researches and applications.
Introduction
Distributed optical fiber sensors (DOFS) have been in rapid development over the past two decades. DOFS is capable of covering long measurement range while maintaining high spatial resolution along the sensing fiber1. According to the operation principle, DOFS can be categorized as interferometry- and reflectometry- based systems. Interferometry based DOFS usually adopts two counter-propagating interferometric structures, in order to locate perturbations by the delay in signal arrival time between the two interferometers2, 3. This technique suffers from poor localization accuracy. Reflectometry based DOFS mostly utilizes Rayleigh4-8, Brillouin9-12 or Raman13 backscattered light for distributed sensing purpose. Vibration, strain or temperature variations could be detected with high sensitivity and spatial resolution with respective DOFS configurations. Phase-sensitive optical time-domain reflectometry (Φ-OTDR) launches highly coherent probe pulses and collects Rayleigh backscattered (RBS) light to detect dynamic perturbations along the sensing fiber5, 6.
The RBS signal of Φ-OTDR appears as a randomly varying trace, but stays unchanged when no perturbation is present along the fiber5. Hence, by demodulating the temporal intensity or phase changes of RBS signal along the fiber, external vibrations can be located and retrieved. For intensity demodulated Φ-OTDR, vibration spectrum can be easily recovered, while the vibration amplitude has a nonlinear relation to the RBS intensity. In order to quantitively reconstruct the vibration amplitude, phase variation at the perturbated fiber segment needs to be demodulated14. Heterodyne detection14-19, I/Q demodulation20, 21, Kramers-Kronig receiver22, RBS self-interference detection23-31 and phase generated carrier32-34 methods are proposed for phase demodulated Φ-OTDR. Besides the detection of dynamic vibrations, Φ-OTDR is also capable of measuring slowly-varying strain or temperature change with a wavelength-swept configuration35, 36. To avoid the time-consuming wavelength sweeping operation, chirped probe pulse is used instead, at the requirement of ultra-high sampling rate37.
Several critical issues deteriorate the sensing performance of Φ-OTDR, including signal fading, limited frequency response range and low signal to noise ratio (SNR). Signal fading arises from the destructive interference of RBS signal, and results in blind spots along the fiber. Multi-frequency source is utilized to suppress signal fading38-40. The frequency response range of Φ-OTDR is proportional to the pulse repetition rate according to the Nyquist Theorem, thus limited by the sensing fiber length. Improved configurations such as interferometer incorporated Φ-OTDR41-44, multi-frequency probe pulse train45-47 etc., are proposed to increase the upper limit of detectable vibration frequency. On the other hand, the detection of low frequency vibration is largely affected by the laser frequency drift and laser phase noise, which also appears in the low frequency band48. Several solutions are proposed to track the laser frequency drift and compensate the RBS signal49-53. Owing to the low intensity nature of the RBS signal, Φ-OTDR suffers from low SNR at far end of the sensing fiber. In order to boost SNR and increase maximum sensing length of the system, distributed Brillouin amplification54, 55 and distributed Raman amplification56, 57 are applied and more than 100 km sensing length is obtained. Pulse coding58-62 and pulse compression techniques63, 64 are introduced into Φ-OTDR to achieve better SNR while maintaining spatial resolution, but the computation complexity is increased. The use of ultra-weak fiber Bragg grating (uwFBG) array65, 66, or enhanced backscattering specialty fiber67 can also raise the intensity level of RBS signal. In the signal digital processing stage, advanced denoising algorithms are applied to filter out the noise and enhance the system SNR without adding extra hardware, including wavelet denoising68, empirical mode decomposition69, 70, two-dimensional edge detection71 and two-dimensional adaptive bilateral filtering72. After SNR enhancement, Φ-OTDR signal still contains undesired environmental disturbance. Pattern recognition algorithms are utilized to distinguish different types of intrusion events in Φ-OTDR signal. Support vector machine (SVM)73, 74, multi-layer perceptrons (MLP)75, 76 and convolutional neural network (CNN)77-79 are used as vibration pattern classifiers.
For practical applications, Φ-OTDR has been introduced into a wide range of scenarios. Because Φ-OTDR offers meter-level spatial resolution over the range of tens of kilometers, it has been utilized in geological exploration for borehole and surface seismic wave detection80-101, providing a new solution to study microseism for geologists. By employing pattern recognition algorithms in the signal post-processing stage, Φ-OTDR is also a promising tool for perimeter monitoring with the capability of accurately locating and recognizing intrusions102-112. Besides, Φ-OTDR has been applied for vehicle and train tracking for its broadband response and long coverage73, 113-118. Monitoring of partial discharge is also achieved by Φ-OTDR for electrical cables78, 119-121. These applications have shown great potential in the future development of Φ-OTDR technology.
In this paper, we will present the recent progress of Φ-OTDR. The paper is organized as follows. In section Principle the operation principle of Φ-OTDR is described, including the intensity- and phase- demodulation schemes. In section The key factors of Ф-OTDR, sensing parameters, such as SNR, frequency response range, maximum sensing length, spatial resolution and perturbation event discrimination accuracy, are discussed. Regarding the improvement of sensing parameters, different techniques employed in Φ-OTDR are provided in this section. In section Applications of Φ-OTDR, we review the applications of Φ-OTDR, including geological exploration, perimeter surveillance, structure health monitoring, traffic tracking and other novel implementations. In section Conclusions, we present conclusion and future perspectives of the Φ-OTDR technology.
Principle
When an optical pulse is transmitted forward along the fiber, RBS occurs due to the uneven fluctuation of the refractive index in the optical fiber, which can be regarded as discrete “scattering points”. Since the optical pulse transmits in the opposite direction with the RBS light, the RBS light generated from the front part of the optical pulse will be superimposed with that generated from the rear part of the optical pulse at a backward position. Finally, the RBS light at the end of the optical pulse is the superposition of the RBS light generated from all the scattering points with a length of , where is the group velocity of light and is the pulse duration.
In Φ-OTDR, the line width of the light source is very narrow, usually less than 100 kHz, so the coherent length is much longer than the pulse width. When a certain section of optical fiber is affected by disturbance, it will change the phase of the RBS passing through the corresponding position, leading to the change of the RBS’s intensity due to the interference effect.
There are two ways for Φ-OTDR to utilize the phase change information of the RBS light. One is to judge the disturbance according to the intensity change of the RBS light, and this type of Φ-OTDR belongs to the distributed vibration sensing (DVS) technique. The other one is to demodulate the phase change of the RBS light induced by the disturbance, namely the distributed acoustic sensing (DAS) technique.
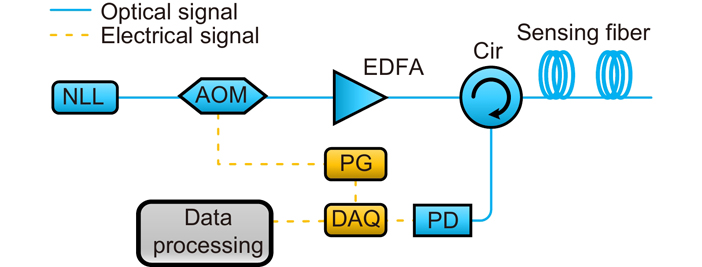
DVS-Φ-OTDR usually adopts the direct detection structure as shown in Fig. 1. A narrow linewidth laser (NLL) emitting highly coherent light is used as the light source and a modulator chops the continuous light into probe pulses. An Erbium-doped fiber amplifier (EDFA) is used to compensate for the power loss. The amplified probe pulses are injected into the sensing fiber through a circulator (Cir). Its RBS light is then routed to a photo detector (PD) through the Cir. The data is collected by a data acquisition (DAQ) system and then transmitted to the data processing system. Pulse signal generator (PG) is employed to provide pulse signal and synchronous trigger signal for the acoustic optic modulator (AOM) and DAQ respectively.
Figure 1.The setup of DVS-Φ-OTDR system based on direct detection.
DVS-Φ-OTDR has simple structure and low cost. One often estimates the disturbance from the intensity change of the RBS signal or from the frequency spectrum of the signal. However, there is no linear relationship between the magnitude of the disturbance and the intensity change of the RBS signal. Therefore, DVS-Φ-OTDR is often used to detect disturbances qualitatively.
When a certain section of fiber is affected by disturbance, it will cause a change in the optical path at the corresponding position, leading to a change in the phase difference of the RBS light generated at both ends of the disturbed fiber section. In theory, the phase difference has a linear correspondence with the disturbance, so a quantitative measurement of the disturbance amplitude can be achieved by demodulating the change of the phase difference, which is the principle DAS-Φ-OTDR.
In order to demodulate the phase information of the RBS light, special designs of the Φ-OTDR system are required. Either heterodyne detection scheme or direct detection scheme can derive the phase information when using proper phase demodulation method. The Φ-OTDR system based on heterodyne detection is shown in Fig. 2(a) and Fig. 2(b). Highly coherent light emitted by NLL is split into two paths with a 90∶10 coupler 1 (OC1). The 90% light wave in the first path is modulated into a probe pulse by an AOM with a frequency shift of . The 10% light wave in the second path serves as the reference signal. The probe pulses are launched into the sensing fiber through a Cir after being amplified by an EDFA. The backscattered signal is mixed with the reference signal via a 3 dB coupler 2 (OC2) and their beat signal is received by a balanced photodetector (BPD). Then the signal of the sensing path is converted into a digital form by a DAQ system. PG is adopted to provide pulse signal and synchronous trigger signals to the AOM and DAQ respectively. In-phase/Quadrature (IQ) phase demodulation and Hilbert-transform phase demodulation are two commonly used methods for the DAS-Φ-OTDR with heterodyne detection scheme. In the IQ phase demodulation method, the beat frequency signal output by the BPD is multiplied by the sine and cosine signals with frequency of respectively. Then the I and Q components are derived after the two signals passing through a low-pass filter. After taking the arctangent of I/Q, the phase information can be obtained21. The IQ demodulation method has simple structure, high SNR and sensitivity, but the result is easily affected by phase noise and polarization noise, and it can only be used for heterodyne detection. In the Hilbert-transform phase demodulation method, the signal is Hilbert-transformed at first. Then the similar procedure is taken for the transformed signal and the original signal as the I and Q components in the IQ demodulation method69. This method can be adopted for both direct detection and homodyne detection while the ability of anti-noise is inferior to the IQ demodulation method. Besides, Φ-OTDR with heterodyne detection can demodulate the phase information of the RBS light combined with the Kramers-Kronig receiver. Although this method is restricted by the detection bandwidth, it can eliminate the influence of signal-signal beat interference (SSBI)22.
Figure 2.The setup of DAS-Φ-OTDR system with different demodulation methods.(a) Heterodyne detection + IQ phase demodulation. (b) Heterodyne detection + Hilbert transform phase demodulation. (c) Direct detection + phase demodulation based on a 3×3 coupler. (d) Direct detection + phase demodulation based on PGC.
Figure 2(c) and 2(d) show the DAS-Φ-OTDR system based on direct detection scheme. The phase demodulation methods are based on a 3 × 3 coupler and phase generation carrier (PGC) respectively. The phase demodulation based on a 3 × 3 coupler is realized by introducing an unbalanced interferometer with a 3 × 3 output port coupler, which has a 120° phase difference between each two arms, to the Φ-OTDR system based on direct detection. Three PDs are used to receive the output optical signal of the coupler23. By processing the three components according to a specific procedure, the phase of the RBS light can be derived. This method has the advantages of large dynamic range, high response bandwidth and no need for modulation devices, while requiring high device consistency and high system cost. The phase demodulation based on PGC is realized by introducing unbalanced MI and PGC modulation and demodulation method. The two most widely adopted PGC algorithms are differential cross multiplication (PGC-DCM)34 and arctan (PGC-Arctan)32. This method owns a large dynamic range, high sensitivity, and good linearity. But it is limited by the power of the light source and the stability of the modulation device. Besides, after the result is obtained with the arctangent function, the actual signal should be recovered with the phase unwrapping algorithm21, 32, 69.
The key factors of Ф-OTDR
Φ-OTDR can achieve distributed measurement of vibration, dynamic strain, etc. Its performance can be estimated by a few key factors, mainly including sensing distance, SNR, frequency response range, spatial resolution, and event discrimination ability. Recent years have witnessed many researchers concerning on these factors, improving the performance of Φ-OTDR effectively.
Sensing distance
Φ-OTDR uses the very weak RBS light as the signal. With the increase of the sensing distance, the signal strength decays exponentially, which renders long-distance measurement difficult. In Φ-OTDR, the maximum length of the sensing fiber is weighed by the dynamic range:
where, is the power of the RBS light at the front end of the fiber, is the minimum optical power that the photodetector can respond to, is the transmission loss in the system. In Eq. (1), the increase of the sensing distance of Φ-OTDR can be achieved by increasing the probe optical power, thus improving the photoelectric detection efficiency and compensating for transmission loss.
Amplifying the probe optical power with EDFA can increase the dynamic range but it is constrained by nonlinear effects like modulation instability (MI) and stimulated Brillouin scattering (SBS)122. And it has been found that in Φ-OTDR, SBS has greater influence than MI in the process of increasing the probe pulse power57. In order to suppress the nonlinear effects, the first-order bidirectional Raman amplification was applied in Φ-OTDR for the first time in 2009123. The optical power maintains a high value that does not exceed the threshold of nonlinear effects within the entire sensing distance, with the sensing distance being increased to 62 km. In 2014, the second-order Raman amplification was used in Φ-OTDR. The power of the probe light was more uniform and the sensing distance was increased to 131 km124. In the same year, F. Peng et al. proposed to apply heterodyne detection and first-order bidirectional Raman amplification to Φ-OTDR at the same time, increasing the sensing distance to 131.5 km57. In the same year, Z. Wang et al. proposed for the first time to apply Brillouin amplification to Φ-OTDR based on heterodyne detection with a much higher pump efficiency than Raman amplification, thus achieving a sensing distance of 124 km54. After that, they also proposed a partitioned distributed amplification method combining the first-order Raman amplification, the second-order Raman amplification, and Brillouin amplification to obtain a sensing distance of 175 km125.
In addition to the widely used distributed amplification methods, some other methods to compensate for losses have emerged in recent years. In 2016, X. Tian et al. proposed to apply bidirectional EDFA (B-EDFA) to Φ-OTDR. This amplifier can amplify not only forward pulsed light but also RBS light, resulting in a 123 km sensing distance126. In 2017, Z. Sha et al. attempted to apply remotely pumped EDFA (RP-EDFA) to Φ-OTDR, achieving a sensing distance of 75 km under a single-ended operation scheme127. Due to its capability of eliminating the necessity of dual-end operation and field power supply, this method is meaningful for long distance sensing in practical applications. In 2018, M. Song et al. used non-balanced optical repeaters to achieve a sensing distance of 150 km128. The repeater consists of two EDFAs and a Raman amplifier (RA), among which one power amplifier EDFA is used to amplify the probe pulses while the other preamplifier EDFA is applied for RBS signals, and the RA for keeping the power along the fiber stable. However, since distributed fiber amplifiers are complex, expensive, and not suitable for practical applications, some simpler techniques have been proposed to increase the sensing distance. In 2015, a simple structure Φ-OTDR system utilizing long pulse, balanced amplified detector and heterodyne detection is applied and the sensing range is thereby increased to 60 km129. In 2019, an ultra-long distance Φ-OTDR system based on direct detection with simple modifications to the structure was proposed. By using cascaded AOMs and optimizing system components, a sensing distance of 94.8 km was achieved130. We have summarized the research progress on improving sensing distance in Ф-OTDR systems in Table 1.
Table Infomation Is Not Enable
SNR
SNR is a key factor determining the performance of Φ-OTDR. It not only determines the sensing distance, but also determines the sensitivity and accuracy. In the preceding section, either amplifying the probe optical power or compensating for the transmission loss can improve the SNR by enlarging the signal intensity. On the other hand, the SNR can also be improved by reducing the noises. In Φ-OTDR, noises mainly originate from interference fading noise of RBS light, polarization-dependent noise caused by polarization state mismatch in coherent detection, phase noise caused by laser instability, thermal noise of the photodiode, and background noise of the environment. In recent years, researchers have proposed many methods to suppress noises.
The interference fading noise will lead to local dead zones, owing to very tiny RBS signal. The solution to this problem is mainly realized by pulse modulation, improving sensing fiber, and demodulation algorithms. In terms of pulse modulation, Z. Pan et al. proposed a phase-shifted double pulse method which gains a SNR greater than 20 dB in 4 km sensing distance15. However, it sacrifices half of the response bandwidth. In 2019, X. Wang et al. added a 0–π binary phase shift on the second half of probe pulse, making interference fading controllable131. Moreover, due to the weak correlation between RBS signals from probe pulses with different frequencies (or different frequency parts of the pulse), the possibility of interference fading can be reduced. In 2018, J. Zhang et al. proposed a Φ-OTDR based on multi-frequency nonlinear frequency modulation pulses, which increased the SNR to 45 dB132. One year later, M. Zabihi et al. used a coherent Φ-OTDR system with three different probe frequencies as well as a tracking algorithm for selecting the optimum RBS signal at any time, which predicts the occurrence of fading and provides the best detection frequency for each moment40. Aiming to avoid complex pulse modulation, in 2019, Y. Wu et al. proposed a novel spectrum extracting and remixing method, using single rectangular probe pulse to realize a simple non-interference fading Φ-OTDR. In the second year, they combined optical pulse coding (OPC) technology, achieving a SNR improvement of 7.1 dB133. In terms of improving the sensing fiber, in 2016, A. Alekseev et al. performed the joint independent analysis to the RBS signal, with a multimode optical fiber as a sensitive element, thereby suppressing or even eliminating the interference fading134. In 2017, X. Zhang proposed a Φ-OTDR system based on uwFBGs through an unbalanced 3 × 3 coupler structure, obtaining a SNR improvement of 56 dB135. As for software algorithms, in 2016, F. Pang et al. distinguished the false alarm peak from the actual vibration alarm peak by comparing the demodulated phases of the RBS light returned from the position before and after the alarm peak, achieving 16 dB SNR in a simple and low-cost way136.
For the polarization-dependent noise, the most important one is the noise caused by thepolarization fading. In 2011, Z. Qin et al. used polarization-maintaining fiber (PMF) in the Φ-OTDR system to suppress the polarization-dependent noise137. In 2016, M. Ren et al. adopted a polarization diversity scheme to reduce the impact of polarization fading, and the SNR was increased by 10.9 dB138. In 2019, F. Wang et al. applied a composite-double-probe-pulse (CDPP) to eliminate the influence of polarization fading for uwFBG array-based Φ-OTDR66.
Regarding the phase noise in Φ-OTDR, it is generally the random change in the phase caused by the laser under the action of various noises. In 2017, A. Alekseev et al. conducted an in-depth study on the influence of the phase noise of the light source on Φ-OTDR, and offered an estimate of the smallest possible average noise when the coherence and pulse width of the light source were determined, which turned out to be really helpful for choosing optoelectronic components139. In 2019, J. Li et al. analyzed and proved the influence of laser’s linewidth on the phase-OTDR sensing system, suggesting a way to select the appropriate laser source for the phase-OTDR system140. With the hope to reduce the influence of the phase noise in Φ-OTDR, Wiener filtering141 and statistics calculating method16 were applied to reduce the phase fluctuation caused by the phase noise of the laser. Moreover, a series of auxiliary weak reflection points along the optical fiber were adopted to compensate for the phase noise17. In 2015, F. Zhu et al. proposed an active compensation method based on laser frequency sweep and cross-correlation calculation to suppress the influence of light source frequency drifting (LSFD), and a vibration event of 0.5 Hz has been identified successfully49. In 2019, F. Wang et al. proposed a twice differential method to compensate for the influence of LSFD in Φ-OTDR, and a vibration event of 0.1 Hz has been identified successfully51. In 2019, they proposed another compensation method using an auxiliary Mach-Zehnder interferometer (MZI), which measured vibration at a frequency of 0.1 Hz on a 6 km sensing fiber52.
Apart from the above-mentioned methods for improving the SNR for each type of noise, there are also many methods for improving the SNR by processing various noises together, which are generally implemented through software algorithms. In 2013, T. Zhu et al. proposed a two-dimensional edge detection (2D-ED) method based on Φ-OTDR, which converted the waterfall chart composed of RBS curves into grayscale images, and each pixel value of the grayscale image was calculated by convolving with Sobel operator. In comparison with the traditional method, the SNR of this method is increased to 8.4 dB71. In 2014, Q. Li et al. found that the frequency characteristics of the backscattered signal in the disturbance area were different from those in other areas and thus proposed a new positioning method based on power spectrum analysis with an improved SNR of 19.4 dB142. In 2017, H. He et al. proposed an adaptive image restoration algorithm based on 2-D bilateral filtering (2D-ABLF) and the proposed two-dimensional bilateral filtering algorithm was used to smooth noise and effectively retain useful signals while the adaptive parameter setting method can set parameters for different types of signals faster and more robustly, and the SNR improvement of 14 dB was confirmed through experiments72. In the same year, adaptive temporal matched filtering (ATMF)143, curvelet denoising144, and empirical mode decomposition (EMD)70 were proposed. ATMF was able to achieve an SNR of over 10 dB without using optical amplifier and reducing the system bandwidth. Curvelet denoising is implemented after converting the original RBS trace into a gray image, which leads to a SNR of 8.0 dB. EMD decomposes the original RBS signal into a series of intrinsic mode functions (IMF) and residual components, which can achieve a SNR of about 40 dB. After that, in 2019, X. Zhang et al. proposed a multi-scale matched filtering method to select the appropriate filter scale and increase the SNR by more than 6 dB even under the influence of strong noise145. In the same year, S. Qu et al. proposed an efficient signal processing method based on compressed sensing (CS) with experimental results showing that when the SNR compression ratio for 100 Hz vibration events on the 3 km sensing fiber is 18.9, the SNR increases to 34.39 dB146. We have summarized the research progress on noise reduction in Ф-OTDR systems in Table 2.
Table Infomation Is Not Enable
Frequency response range
In Φ-OTDR, the repetition period of the probe pulse is larger than its round-trip time. For each pulse, it can sample the disturbance one time. Thus, according to the Nyquist sampling law, the maximum frequency response of the system is:
where is the minimum pulse repetition period, L is the length of sensing fiber, is the group velocity of light. According to Eq. (2), the capability of locating and recognizing high-frequency vibration events is mainly limited by sensing distance in traditional Φ-OTDR.
Aiming to enlarge the frequency response range of the Ф-OTDR system, a method combining Φ-OTDR with MZI using a pulse pair of wide pulse and narrow pulse as the probe light is proposed, where the narrow pulse is used for Φ-OTDR to achieve high spatial resolution while the wide pulse for MZI to achieve a wide frequency response147. The maximum frequency response of 3 MHz was achieved in a 1064-m long fiber when the narrow pulse width is 50 ns. Nonetheless, there will be conflicts between the spatial resolution and frequency response owing to the crosstalk of interference signals and scattered signals in this method. As a result, improvement schemes on the basis of time division multiplexing (TDM)148 and wavelength division multiplexing (WDM)149 are proposed. Both methods avoid the crosstalk of interference signals and scattered signals, and the TDM scheme increases the upper limit of frequency response by a factor of two while the upper limit of the frequency response of the WDM scheme is almost only limited by the sampling speed of the acquisition hardware. There is another method only using Φ-OTDR to improve the frequency response, which uses pulses of multiple frequencies instead of single frequency pulse. Whether it is modulated into a pulse pair with a frequency difference44 or a multi-frequency pulse sequence with time sequence150, the principle is to make the sampling points denser, thereby increasing the upper limit of the response frequency. In 2017, Y. Zhang et al. proposed a hybrid single-end-access MZI and Φ-OTDR vibration sensing system, the RBS signal and the continuous wave reflected by the FSM at the end of the fiber interfere with the reference light at the same end, the experimental results show 1.2 MHz frequency response along a 6.35 km long fiber42. Additionally, some interferometer structures other than MZI have been introduced into Φ-OTDR, including distributed feedback interferometer (DFI)43, feedback loop-based interferometer (FLI)151 and Sagnac interferometer152.
In regard to the multi-pulse modulation, G. Yang et al. introduced Frquency Division Multiplexing (FDM) technology into the Ф-OTDR based on direct detection with a maximum frequency response of 20 kHz at a measurement distance of 10 km by using frequency stepping scanning laser source and double-pulse heterodyne detection in 201847. Compared with the FDM method, orthogonal frequency division multiplexing (OFDM) can use more carrier frequencies to enhance the system frequency response. M. Wu et al. in 2020 proposed a weak reflector array Φ-OTDR system based on OFDM, which achieved a maximum frequency response of 25 kHz at a sensing distance of 51 km153. In 2019, a new method based on additive random sampling (ARS) and non-linear frequency modulation (NLFM) was reported to enhance the frequency response of long-range Φ-OTDR system, receiving a maximum frequency response of 20 kHz at a sensing distance of 50 km154. We have summarized the research progress on improving frequency response range in Ф-OTDR systems in Table 3.
Table Infomation Is Not Enable
Spatial resolution
The spatial resolution of the Φ-OTDR system refers to the shortest distance between different events that can be distinguished. It reflects the spatial recognition and positioning capabilities of the sensing system. The spatial resolution is related to the probe pulse width , the sampling rate of the photodetector as well as the acquisition card, and so on. In practical applications, the spatial resolution is mainly limited by the probe pulse width, as the other factors can be optimized by utilizing suitable hardware components. However, the reduction of the pulse width will lead to a decrease in SNR, along with the decrease of the sensing distance. As a result, the improvement of the spatial resolution needs to be realized without reducing the probe pulse width.
Using software algorithms is an important method to improve spatial resolution. In 2010, Y. Lu et al. used heterodyne detection with moving average and moving difference methods to process Φ-OTDR signals, reducing the spatial resolution to 5 m6. In 2013, T. Zhu et al. proposed a 2D-ED method, and the spatial resolution is reduced from 5 m to 3 m71. In 2019, Q. He et al. proposed a high-order cumulant (HOC) method, which also improved the SNR and spatial resolution when detecting non-Gaussian vibration signals155.
By virtue of the use of different signal processing algorithms, the improvement of the Φ-OTDR structure can further improve the spatial resolution. In 2017, A. Masoudi et al. used two separate FBGs in the Φ-OTDR and MZI composite system to reduce the amplified spontaneous emission (ASE) noise from the power amplifier and preamplifier. Combined with improved signal processing algorithms, the spatial resolution increased by 4 times27. However, the spatial resolution of this scheme is still limited by the MZI path difference. A year later, S. Feng et al. used two Michelson interferometers with different optical path differences to obtain two RBS phase curves with different spatial resolutions through the PGC algorithm156. After adopting the differential and adaptive two-dimensional bilateral filtering algorithm, a spatial resolution of 0.8 m is obtained.
In the same few years, targeting at improving the spatial resolution, scholars began to look back on the pulse but no longer reduced the pulse width. In 2017, B. Lu et al. proposed to apply the pulse compression technology to Φ-OTDR, breaking the limitation between spatial resolution and sensing distance while achieving a spatial resolution of 30 cm63, 157. In the second year, in order to prevent the nonlinear radio frequency (RF) signal from causing a decrease in the spatial resolution and SNR of the system, they proposed a new scheme to generate the linear RF signal. Furthermore, the improved frequency sweep pulse (FSP) Φ-OTDR system has achieved a spatial resolution of 0.95 m over a 75 km sensing distance158. In 2019, improvements were made on the Φ-OTDR system based on chirped pulses by adding the optical carrier to the input chirped pulse and implementing digital filtering to the measured RBS signal. The experimental results indicated that the method would reduce the resolution by 10 times with little impact on the SNR159. We have summarized the research progress on improving spatial resolution in Ф-OTDR systems in Table 4.
Table Infomation Is Not Enable
Event discrimination
Although the conventional Φ-OTDR system can locate external disturbances, it is insufficient for distinguishing different types of intrusion events. In order to solve this problem, pattern recognition algorithms have been extensively studied for Φ-OTDR signal post-processing in recent years102-112. Pattern recognition algorithms can automatically classify the detected vibration signals into intrusion of interest, and undesired environmental noise, according to their signal features, thus dramatically increasing the alarm accuracy and reducing false alarm rate of the system. Generally, pattern classification consists of two stages, namely the feature extraction and classification stages. The extracted feature vectors generally include time-domain features, frequency-domain features, time-frequency domain features, and time-space domain features, and the classification methods are generally made up by threshold-based decision tree and machine learning algorithms while machine learning algorithms mainly contain SVM160, relevant vector machine (RVM)161, MLP162, Gaussian mixture module (GMM)105, CNN163 and other types of artificial neural networks (ANN).
The time-domain feature is directly extracted from the time domain curve of Φ-OTDR. In 2014, H. Zhu et al. used the level crossing rate as the feature, which set an empirical value as the threshold value and calculated the rate of the measured curve crossing through the threshold value. After comparing the rate with different thresholds, three types of intrusions were recognized164. In the same year, H. Wu et al. conducted singular spectrum analysis (SSA) on the longitudinal time series of Φ-OTDR, correctly distinguished real intrusion from background noises, and controlled the false alarm rate at about 6%165. In 2017, aiming to reduce the false alarm caused by the polarization related noise, F. Bi et al. injected two pulses with orthogonal polarization states into the sensing fiber, and analyzed the correlation between the two measured backscatter curves166. The calculated average and variance of the correlation coefficients are used as feature, and judged whether it is an intrusion or a false alarm. In 2018, F. Jiang et al. adopted the spatial average kurtosis (SAK) as the feature, which was obtained by moving the kurtosis of the signal, resulting in the successful identification of two instantaneous destructive disturbances104.
Compared with time-domain features, frequency-domain feature extraction is more reliable. In 2014, Q. Li et al. carried out power spectrum analysis and used the total energy of each sampling point as a feature to locate the intrusion142. In 2015, H. Qu et al. used energy information entropy as the feature to identify raindrop vibration source, and the fundamental frequency as the feature to identify construction machine and train or car passing by167. In the same year, C. Cao et al. selected the total energy, the ratio of the low-band energy to the total energy, and the ratio of the peak amplitude to the average value of the spectrum as three features. Using SVM, the average recognition accuracy of five events reached 92.62%74. In 2016, A. Papp et al. divided the FFT spectrum into 10 frequency bands, using the sum of the normalized coefficients of the 10 frequency bands as features, and the train position can be extracted with SVM from the original data with background noise73.
The time-domain feature or frequency-domain feature is only one feature values extracted from a certain length of sample. The first method used for time-frequency domain analysis is the wavelet transform (WT)68. In 2013, H. Wu et al. performed multi-scale wavelet decomposition (WD) on time signals, and the obtained coefficients at different scales were used as features168. In 2014, Q. Li et al. proposed a Φ-OTDR positioning scheme based on wavelet packet transform (WPD)169. Moreover, H. Wu proved in 2017 that the event identification effect of WPD was better than that of WD170. Subsequently, the short-time Fourier transform (STFT) was also adopted for time-frequency domain analysis. In 2015, the feature vector was formed by performing STFT in a fixed time length and calculated the energy of each frame in the frequency band102. One year later, they performed STFT in three different time length, thereby improving the recognition accuracy103. However, although STFT combined with GMM and MLP can recognize more than 8 types of intrusion events, its spatial resolution is poor102, 103. In order to solve this problem, X. Hui et al. proposed to apply the Hilbert-Huang transform (HHT) to Φ-OTDR. The process of HHT is to use the empirical mode decomposition (EMD) to decompose a given signal into several intrinsic modal functions (IMF), and then perform Hilbert transform on each IMF to get the corresponding Hilbert spectrum69. In 2017, F. Jiang et al. used Mel-frequency cepstrum coefficients (MFCC) as features and input them into CNN to determine 5 types of events171.
Similar to the time-frequency domain, what the time-space domain extracts is not a feature value but multiple features of a part of the intrusion signal from adjacent sampling points. In 2014, F. Peng et al. applied normalized sliding variance to perform edge detection, and obtained the relative position and speed of two trains in real time over a measurement length of 10.2 km113. In 2015, Q. Sun et al. extracted morphological features from time-space domain intrusion signals and combined them with RVM to recognize three types of events while at the same time improving the accuracy and shortening the calculation time172.
Of course, different domain is not completely used on its own. For example, in 2017, C. Xu et al. combined the level crossing rate and power spectrum analysis, and used SVM to realize the identification of four events173. In 2018, T. Marie et al. proposed a recognition method combining time-domain features and time-frequency domain features. After performing EMD on time-frequency entropy and center-of-gravity frequency, probabilistic neural networks (PNN) are used to recognize three types of events174. We have summarized the research progress on event discrimination in Ф-OTDR systems in Table 5.
Table Infomation Is Not Enable
Applications of Φ-OTDR
With appropriate optical configurations, Φ-OTDR is capable of measuring vibration23, strain or temperature distribution36, 37, 175 at high spatial resolution (~m) over long distance (~km). Such ability makes Φ-OTDR a promising tool in various scenarios, including geological exploration80-101, perimeter monitoring102-112, traffic sensing73, 113-118, partial discharge monitoring78, 119-121, and other novel applications94, 95, 176-184. This section reviews the recent progress of advancing Φ-OTDR applications in separate fields.
Geological exploration
Conventional geophysical research relies on discrete geophones for the detection of seismic wave. In order to fully reconstruct the propagation of seismic wave and understand the structure of Earth, these geophones are configurated to be a point sensor array. Compared to geophone arrays, Φ-OTDR brings the advantage of spatially much denser sampling points. Besides, Φ-OTDR is a cost-effective, easy-to-deploy solution, which can be utilized in the existing optical telecommunication fiber96, 98, 99, 101. Over the last decade, Φ-OTDR has been applied for reservoir exploration in borehole80-93, and surface seismic wave monitoring both on the ground96-99 and under water100, 101.
Under collaboration of Shell and Optasense company, first field trails of borehole monitoring by Φ-OTDR was demonstrated80, 83 in 2011. Sensing fiber was deployed in two wells of 2 km and 4 km in depth. For the first site, zero-offset vertical seismic profiling (VSP) and walk-away VSP (see Fig. 3) was monitored by Φ-OTDR to track the underground CO2 containment and injection plume respectively. Results of Φ-OTDR and geophone were similar in signal amplitude, but the noise floor of Φ-OTDR signal was slightly higher. For the second site, sensing fiber covered 4 km depth of the well to record VSP. In this study, though its SNR was worse than the geophone, Φ-OTDR demonstrated low-cost, long coverage, simple and permanent deployment, and hence great potential for borehole VSP measurements.
Figure 3.Operation principle of Φ-OTDR based VSP monitoring system. (a) Zero-offset VSP. (b) Walk-away VSP.
More demonstrations of distributed borehole monitoring by Φ-OTDR technique were carried out for VSP87, 89, hydraulic fracturing monitoring81, 82, 85 and flow speed monitoring86 purposes. These results have proved the advantages of Φ-OTDR, whereas also showing serious drawbacks. Because Φ-OTDR measures the axial strain change of the sensing fiber, the system is not sensitive to the S-wave when fiber cable is deployed straightly down the borehole. This may be resolved by deploying the fiber cable in a helical way90-95. Besides, to increase the signal quality, the optical fiber needs to be more tightly attached to the borehole tubing or casing, and more advanced denoising algorithms may be utilized. A comprehensive review on this subject can be found in reference185.
Besides the borehole deployment, Φ-OTDR was also utilized with horizontal fiber cable for earthquake detection and near-surface structure mapping. By utilizing the existing telecommunication fiber cable for sensing purpose, earthquakes can be located and recorded. With a 15-km long fiber cable deployed in Iceland, an Mb ~6.2 earthquake at Indonesia was successfully detected by Φ-OTDR system98, as shown in Fig. 4(a, b). The results agreed well with data from geophone measurement. By recoding earthquakes, subsurface fault zone along the fiber cable was also identified in Φ-OTDR signal, as indicated in Fig. 4(c). Another field tests of earthquake detection was carried out in California, USA with a 20 km dark fiber cable99. Teleseismic signal with epicenter distance up to 7757 km was recorded. In 2018, Z. Li et al. took the advantage of high spatial sampling density in Φ-OTDR system and achieved microseismic wave detection below noise level186. The authors adopted template matching algorithm to process the Φ-OTDR signal recorded over two weeks. 116 earthquake events, including 68 below noise level, were identified using this approach. This study demonstrated the potential of Φ-OTDR system to reconstruct low-amplitude coherent seismic waveforms, because of its dense sampling channels along the fiber cable, or the so-called large-N array.
Figure 4.(a) Normalized strain (green curve) recorded during an Mb ~6.2 (USGS) earthquake (Kota Ternate, Indonesia, 2015-03-17 22:12:28 UTC, 1.669°N; 126.522°E, 44 km depth) superimposed with the normalized velocity record (red curve) from the broadband station RAH (80 m from the optical cable). (b) Zoom-view from (a) showing a good phase correspondence between seismometer velocity record and DAS strain records at a 20s period. (c) Short record (6 s) of strain phases from a local earthquake trapped in the fault damage zone. Waves inside and outside the fault zone have different apparent velocities. Figures reproduced from ref.98, under a Creative Commons Attribution 4.0 International License.
Distributed detection of seismic wave was also carried out in submarine optical fiber cables with Φ-OTDR system100, 101. A 20-km long offshore fiber cable was used for a 4-day subsea seismic wave recording experiment100. By collecting the wavefield of a Magnitude 3.4 earthquake, local fault zones under seafloor was revealed in the Φ-OTDR signals, corresponding well with the known fault zone locations. Besides earthquake, the hydrodynamic process induced microseism was also recorded in the signal. In a similar study, a chirped pulse Φ-OTDR37 was utilized to measure the strain variations along a 40-km long submarine fiber cable in Belgium101. An Mw 8.2 earthquake in Fiji was captured by the Φ-OTDR and compared to onshore geophone data (see Fig. 5(a)). Additionally, by transforming raw data into logarithmic space of the frequency-wavenumber domain, ocean wave and seismic wave with different phase velocities were separated, as shown in. Fig. 5(b). Though some of the oceanic signal patterns were not fully explained in these works, Φ-OTDR was proved to be a promising tool for future submarine geological and oceanological research in the proof-of-concept experiments.
Figure 5.(a) Stacked DAS beam trace (black) filtered to various bands between 0.02 and 1 Hz compared with amplitude-normalized particle velocity from a broadband seismometer rotated into the mean azimuth of the DAS array (red). (b) Separation of ocean and seismic waves in the first quadrant of the logarithmic space of the Φ-OTDR signal frequency-wave number domain. Figures reproduced from ref.101, under a Creative Commons Attribution 4.0 International License.
Ambient noise interferometry technique refers to the study of interference phenomena between pairs of ambient noise seismic signals from different sampling channels, in order to obtain information about the near-surface earth structure187. Compared to the conventional geophone array, the sensing optical fiber of Φ-OTDR provides spatially much denser sampling channels, hence additional geological information may be extracted96-99. In ref.97, fiber sensing cable and geophone array were deployed near a highway to record traffic noise. By comparison, the cross-correlation results of seismic signals obtained from Φ-OTDR and geophones showed similar quality. The seismic wave phase velocity calculated from Φ-OTDR acquired traffic noise was also consistent with the results from Φ-OTDR monitoring active source experiments. This study proved the feasibility of Φ-OTDR based ambient noise interferometry. S. Dou et al. recorded traffic noise for three weeks with a 100-m long fiber cable perpendicular to road96. The authors illustrated the ability of Φ-OTDR system to record the multichannel surface wave for the time-lapse shear wave imaging via ambient noise interferometry. In 2018, Φ-OTDR system was deployed in a 15-km long existing telecommunication fiber cable98. As shown in Fig. 6, the ambient noise interferometry results obtained from cross-correlating Φ-OTDR signals clearly revealed structural fault zones and volcano dykes along the fiber. Overall, Φ-OTDR based ambient noise interferometry avoids spatial aliasing, thanks to the dense sampling channels, and offers great potential for revealing near-surface structural features more accurately.
Φ-OTDR with different optical configurations have been widely adopted in geological researches. Because of its densely spaced sampling channels over long distance, Φ-OTDR provides a new solution for accurate microseism detection and near-surface structural mapping. But improvement is needed for the low SNR and poor transverse strain sensitivity of Φ-OTDR in future studies. If integrated with Φ-OTDR, the existing telecommunication fiber cables around the globe can be potentially converted to a seismic wave sensing network of wide coverage, broadband response and high spatial resolution, providing valuable data for geological researches, both onshore and offshore.
Figure 6.Ambient noise based, cross-correlation computed between all Φ-OTDR traces of the cable with respect to one arbitrary trace (at position ~11.5 km) showing several geological features. Figure reproduced from supplementary material of ref.98 under a Creative Commons Attribution 4.0 International License.
The task of perimeter monitoring is to prevent third-party intrusions from borderline or enclosed area. Common perimeter monitoring scenarios include national borders, natural reserves, pipelines, and railways188-190. In these scenarios, fast detection and accurate locating of intrusion events over long distance is a basic requirement. The Ф-OTDR technology relies on vibration signals to locate the disturbance source, and its sensing distance can reach 100 kilometers57. Standard single-mode fiber in existing communication cables can be utilized as the sensing fiber of Φ-OTDR, providing cost-effective, fully distributed monitoring over long distance, making Φ-OTDR a suitable candidate for perimeter monitoring applications. Perimeter monitoring applications employing Φ-OTDR system with the pattern recognition capability are discussed in the following context. A more detailed review can be found in ref.191.
The first Φ-OTDR based intrusion detection experiment was conducted by J. Juarez et al. in 20055. Buried single-mode fiber cable was utilized to perform outdoor field tests. Intrusion events of human walking were located along the 2-km long fiber. J. Tejedor et al. have conducted thorough analysis of a Ф-OTDR based pipeline monitoring system102, 103, 105, 107. Fiber cable buried parallel to an active gas transmission pipeline was adopted for the Φ-OTDR sensing purpose. Six locations along the fiber were selected to perform intrusion detection experiments, as shown in Fig. 7. Four different machines performing different activities were used as an external vibration source, totaling 8 types of event for classification. In ref.102, 103, GMM algorithm was employed as the classifier. Short-time Fourier transform was adopted to extract feature vectors from Φ-OTDR data. In the testing stage, the threat detection accuracy of 80% and false alarm rate of 10% were achieved, although the machinery activity identification accuracy was only 46.6%. Besides, the authors proposed a novel classification network that employed contextual feature extraction107. Three temporal windows with the size of 5 s, 12.5 s and 20 s were applied to extract the fast-varying and slow-varying patterns from Φ-OTDR signal. A combination of MLP and GMM structure was employed as classifier. The final classification decision was obtained by combining the three contextual classification results. In this test, machinery activity identification accuracy was around 55%, achieving slight improvements over ref.103. The on-site pattern recognition experimental results in their works have shown promising results. But the classification accuracy and false alarm rate are still in need of improvement in order to meet practical application requirements.
Figure 7.Experimental site layout. Figure reproduced from ref.103, under a Creative Commons Attribution 4.0 International License.
As an alternative approach, one dimensional CNN (1D-CNN) was used to classify intrusion events along pipeline192. Vibrations signals collected by Ф-OTDR were first processed by wavelet decomposition76 to enhance SNR. The denoised data was then processed by the proposed 1D-CNN algorithm, as shown in Fig. 8. Digging, excavation and environmental noise generated vibration signals were included in the experiment. The classification results showed very high accuracy.
Figure 8.Fiber cable layout and operation principle of 1D-CNN. Figure redrawn after ref.192.
Y. Bai et al. performed intrusion recognition tests along a 33 km long pipeline with Ф-OTDR106. Digging and excavation were conducted at 1.8 km, 3.1 km, 20 km and 21 km of the sensing fiber to build up training and testing dataset. The authors used a CLDNN (convolutional long short-term memory deep neural network) for the classification of digging and excavation. The results showed very high accuracy of more than 95%. However, the data was only recorded at four locations for several minutes in this study. This may lead to a biased pattern recognition result.
Ф-OTDR technology has also been applied for intrusion pre-warning of subway tunnels. In 2020, L. Xin et al.112 used the Ф-OTDR system based on a uwFBG array to monitor ground intrusions above a 3-km long subway tunnel. The average depth to the ground surface of the sensing fiber was 22.6 meters. Local characteristics-scale decomposition193 was used to decompose the event into a series of intrinsic scale components, and multi-scale permutation entropy194 was applied to extract the signal feature vectors, representing the complexity and randomness of the original signal at different scales. Finally, SVM was used to classify the intrusion signal based on its feature vector. Experimental data showed an average recognition rate of 96.57%.
Another typical perimeter monitoring scenario is the protection of railways. In 2019, Z. Wang et al. carried out perimeter monitoring field tests with existing fiber cable buried alongside rail track, as illustrated in Fig. 9. Seven types of vibrations were applied at three railway lines for multiple times to retrieve more generalized Ф-OTDR sensing data. Raw data was segmented and transformed into a two-dimensional frequency-space representation by using the short-time Fourier transform. Then the authors utilized a dual path network (DPN)195 for the recognition of the two-dimensional data. Very high (>97%) accuracy was obtained with this approach. One of the shortcomings in this study is the deep structure of the DPN algorithm. The 100-layer DPN used here requires large amount of training data, leading to huge time consumption if the system is to be relocated to another field condition.
Figure 9.An illustration of the railway safety monitoring experiments. Figure reproduced from ref.108, under the OSA Open Access Publishing Agreement.
Φ-OTDR has been utilized to detect the vibration or seismic wave generated by train and vehicle in motion, in order to monitor their position, speed and the overall traffic situation73, 113-118. With the help of more advanced signal processing methods to better analyze the traffic status, Φ-OTDR may play an important role in transportation monitoring in the near future.
F. Peng et al. first carried out train monitoring experiments with direct-detection Φ-OTDR in 2014113. A fiber cable was deployed parallel to the railway with 15–20 m distance at depth of ~1 m over ~10 km. Two trains moving in opposite directions were recorded by Φ-OTDR, as shown in Fig. 10. The local vibration traces were first denoised with the wavelet method to obtain train vibration signals with better SNR. Then the train moving behavior was analyzed by applying the edge detection approach to the Φ-OTDR signal in time-space domain71, 72. The edges were defined as the peak locations of the signal variance calculated with a normalized sliding window. The consecutive rising and falling edge traces corresponded to the head and tail of the train respectively. The speed of the train was obtained by calculating the slope of the edge trace. In this work, the authors presented proof-of-concept experiments of train monitoring Φ-OTDR system. The feasibility of Φ-OTDR for transportation monitoring purpose was clearly demonstrated.
Figure 10.Fiber cable layout alongside railways. Figure redrawn after ref.113.
In 2015, Z. Wang et al. demonstrated a vehicle monitoring system with balanced-detection Φ-OTDR114. Fiber was attached to the ground at two sides of the road and covered in cement. The vibration generated by a moving vehicle was detected by the fiber. The authors employed the short-time Fourier transform and 2D digital sliding filter method to enhance the signal and filter out environmental noise. Then vehicle tracking and speed monitoring results of high SNR were presented. Similar approach was also utilized for railway monitoring by the authors196. However, the noise filtering algorithms employed in this work relies heavily on pre-selected parameters or thresholds. More generalized data processing techniques are needed in future studies.
Later in 2016, A. Papp et al. proposed an improved train tracking Φ-OTDR system73. Vibration signal was recorded by Φ-OTDR along a 13 km long railway. The vibration signal was segmented into a one-second frame at each fiber sampling position and Fourier transformed into vibration spectrum. Feature vectors of the vibration signal were formed by taking the sum of Fourier coefficients of the 10 frequency bins in the 0–1000 Hz band. Principle component analysis was applied to choose 2 most relevant elements out of the 10-dimensional feature vector, in order to reduce computation complexity. Then classification of train and background noise was achieved by training an SVM algorithm train tracking and speed calculation results were presented for 15 trains, and the positioning errors were analyzed. Recently, the authors made an improvement to the train tracking algorithm118. K-means clustering was applied to coefficients results of Ricker wavelet decomposition with two different widths in the edge detection stage. The detected edges were automatically assigned to trains with a greedy approach. Kalman filter was used to retrieve the final train tracking results. Experiments were carried out in two separate sites to prove the flexibility of the algorithm. The train tracking accuracy was similar for both sites.
M. Huang et al. demonstrated a road traffic monitoring system by integrating Φ-OTDR in pre-existing telecommunication fiber cables116. In their setup, the unoccupied wavelength channel was selected to transmit Φ-OTDR probe pulses and the corresponding Rayleigh signals, while the other channels in the DWDM system were still used for communication purpose (see Fig. 11). In order to avoid nonlinear effects, Φ-OTDR pulses and the communication data were counter-propagated in the fiber. Road traffic sensing experiments were carried out in two sections of fiber cable buried at ~1 m deep with length of 55 km and 25 km respectively. By performing normalization and binarization over the raw waterfall Φ-OTDR signal, vehicle moving speed and direction were clearly presented. The authors achieved measurement accuracy of 94.5% for vehicle density estimation, and 98.5% for vehicle speed monitoring. By further analyzing the spectral features of the vehicle induced vibrations along the fiber, road roughness of three different levels was successfully classified by SVM algorithm with 85% accuracy. In this study, the feasibility of employing Φ-OTDR in urban telecommunication cables for traffic status monitoring was proved with preliminary experimental results.
Figure 11.Integration of Φ-OTDR system in the DWDM communication network. Figure reproduced with permission from ref.116, IEEE.
The partial discharge phenomenon of high-voltage electrical cable is one of the early manifestations of various cable failure. Early detection of partial discharge is thus important for electrical cable protection. Distributed fiber optic sensors have the advantage of small size, electromagnetic interference immunity, high sensitivity, long measurement range and remote sensing capability197, which makes it a suitable candidate for highly reliable monitoring purpose of large-scale infrastructures. Φ-OTDR applications of partial discharge detection and rail track strain monitoring are described as follows.
When partial discharge occurs, abnormal signals such as local overheating, ultrasonic waves, and electric pulses will be generated198, 199. By monitoring these characteristic signals, the partial discharge of the cable can be judged and located. Traditional monitoring methods, such as high-frequency pulse current monitoring, are not enough to meet engineering demands in terms of anti-electromagnetic interference and event location accuracy200, 201. In contrast, by detecting the high-frequency acoustic emission, Φ-OTDR based scheme can meet the requirement of accurate localization of partial discharge along the entire electrical cable78, 119-121, 202.
P. Rohwetter et al. reported for the first time a Φ-OTDR based partial discharge monitoring system119, 202. As shown in Fig. 12, two fiber coils were used as acoustic transducers and attached to the electrical cable joint. Approximately 30 meters of fiber was wrapped around each coil to enhance Φ-OTDR sensitivity, and to enable the use of random quadrature demodulation (RQD) algorithm202, 203. The acoustic emission of partial discharge is transient in time and low in amplitude. RQD method operates under the assumption that all sampling channels defined by gauge length experience homogeneous fiber strain in the same fiber coil. RBS traces of all channels within one coil were processed by RQD to capture the transient high-frequency acoustic pulses. The results showed a sensing limit of about 1 nC for partial discharge detection with a 40 kV electrical cable joint.
Figure 12.Experimental setup for discharge detection with two acoustic transducers attached to the 40 kV joint. (Figure redrawn after ref. 119)
To better understand the partial discharge behavior, Pan et al. studied the propagation model of acoustic wave inside the electrical cable120. Using this model, the authors obtained the relation between acoustic pressure and the deformation of sensing fiber inside the cable or attached to the cable outer surface (see Fig. 13). Simulated and experimental results of Φ-OTDR response for partial discharge were presented for different types of cable and different amount of electrical charge. This study provides preliminary results of Φ-OTDR based partial discharge sensing system for future reference.
Q. Che et al. proposed a pattern recognition algorithm for the classification of partial discharge signal with Φ-OTDR78. An array consisting of 290 weak FBGs (wFBG) in a 1.5 km long fiber was utilized as sensing fiber, in order to increase the RBS intensity and system sensitivity. The wFBG array was helically wrapped around a cross-linked polyethylene (XLPE) electrical cable, tightly covered with aluminum tape. After detected by phase demodulated Φ-OTDR, the local acoustic signal was decomposed by wavelet transform and reconstructed with only high frequency components. The SNR enhanced signal was then processed by a pattern recognition algorithm to be classified as one of the three types of partial discharge, namely the internal, corona and surface partial discharge. The feature vectors were formed by calculating the Mel frequency cepstral coefficients of the signal. CNN was employed as the pattern classifier to finally locate and recognize the partial discharge induced acoustic emission signal. Under lab condition, the authors obtained event discrimination accuracy of more than 95%.
Figure 13.Fiber deployment inside or outside electrical cable. (Figure redrawn after ref. 120)
Φ-OTDR was also applied to breakdown discharge analysis for gas insulated switchgear (GIS), and successfully realized the detection and precise positioning of partial discharge in high voltage condition121. A cylindrical elastomer was designed and 3D printed using high Poisson’s ratio materials. Fiber coil was then wrapped around the cylinder to form an acoustic transducer. This structure would improve the fiber length change induced by external acoustic emission, hence increase system sensitivity. The proposed Φ-OTDR system were multiplexed with seven fiber transducers, each attached to the outer surface of a GIS partial discharge simulation device (see Fig. 14(a)). IQ demodulation was employed to extract the optical phase variation along the sensing fiber. Fast and accurate partial discharge response was presented in the experimental results, as shown in Fig. 14(b).
Figure 14.(a) Fiber coil transducer deployment on the GIS device. (b) Detected discharge signal of transducer #1, #2 and #3 at pulse repetition rate of 10 kHz. Figure reproduced from ref. 121, under a Creative Commons Attribution 4.0 International License.
Most of the Φ-OTDR configurations above employed sensitivity enhancing methods to detect the low-amplitude acoustic emission of partial discharge phenomenon78, 119, 121. But the fiber coil structure and the wFBG array are quasi-distributed sensing approaches. Future study may focus on the improvement of optical sensing principles to realize sensitivity enhancement over the entire fiber.
Novel applications
The above-mentioned research works are organized by their application scenarios, with relatively conventional optical setup. There are still many reported Φ-OTDR applications that belong to none of the categories above. Some cases used the conventional setup for novel application purposes, such as the detection of pest infestation182, while other cases introduced specialty fiber or advanced post-processing algorithms to translate the measurement of target physical parameters into the detection of vibration, strain or temperature variations along the sensing fiber, such as gas concentration level176, 177 and fiber bending direction181. These novel applications have proven Φ-OTDR systems to be a promising tool for a broad range of scenarios with enormous potential.
Conventional Φ-OTDR system can locate the perturbated fiber section along the sensing fiber, but unable to provide the position information of the vibration source in space. Inspired by array signal processing from radar and microphone technology, J. Liang et al. achieved vibration source localization in 2D plane/3D space with phase-demodulated Φ-OTDR178. The sensing fiber was treated as a linear sensor array formed by equally-spaced discrete sensing channels, with the channel interval slightly larger than Φ-OTDR spatial resolution. Under the far-field assumption, multiple signal classification (MUSIC) algorithm was applied to achieve 2D and 3D localization of acoustic sources. Preliminary results of detecting multiple acoustic sources and moving acoustic sources were presented by the authors. Because of its capability of providing true position of the acoustic source over long distance, this method possesses great potential for many applications, although further discussion of angle and distance resolution, broadband acoustic source detection and far-field/near-field condition is needed to improve its feasibility.
I. Ashry et al. proposed a non-invasive red palm weevil infestation early detection system based on direct-detection Φ-OTDR182. By winding optical fiber around target palm trees (see Fig. 15(a)), the proposed Φ-OTDR system can measure the feeding sound of weevil larvae. The identification of larvae feeding sound from environmental noise was achieved through comparing the SNR with a predetermined threshold in the 200–800 Hz frequency band. The authors demonstrated a two-hour proof-of-concept experiment on infested and healthy trees. As shown in Fig. 15(b), the result showed 97 true alarms for the infested tree and 9 false alarms for the healthy tree during the two-hour period. With 10-meter spatial resolution and 1.1 km total fiber length, the system can cover ~100 palm trees at the same time. Because of its non-invasive nature and excellent multiplexing ability, this proposed system shows great potential to be a cost-effective pest infestation detection method, although a significant improvement on signal post-processing algorithm is still needed in order to achieve better infestation identification accuracy and lower false alarm rate.
Figure 15.(a) Φ-OTDR system configuration. (b) Tree infestation sensing results. (Figure reproduced from ref.182, under a Creative Commons Attribution 4.0 International License.
In 2015, a distributed strain measurement system based on frequency-swept Φ-OTDR was proposed36. The central frequency of the probing pulse was shifted increasingly at each measurement cycle to obtain the Rayleigh spectra for all discrete fiber sampling positions. When strain was applied at certain position, the strain induced optical phase change can be compensated by shifting the frequency of the probing pulse, comparing to the strain-free case with no frequency shift. Hence, by calculating the cross-correlation curve between the measured spectra under strain ∆ε and the reference spectra with no strain, the cross-correlation peak reaches maximum at the corresponding compensating frequency shift value ∆υ. The frequency shift ∆υ is proportional to the applied strain ∆ε, so the ∆ε can be quantitively obtained by using this method. The authors achieved 10 nε strain resolution over 9 km fiber length in their experiment.
Conventional Φ-OTDR measures the Rayleigh backscattering intensity or phase variations along the sensing fiber, in order to detect the local axial dynamic strain changes. But the direction of the strain is not detectable with the conventional method, as it is not relevant to the value of Rayleigh intensity or phase change204. By multiplexing frequency-swept Φ-OTDR systems in different cores of a multicore fiber (MCF), L. Szostkiewicz et al. realized distributed bending direction sensing over 24 m long MCF with 10 cm resolution181. When one section of the MCF is bent, different cores experience different strain variations in the same fiber cross-section. As a result, by selecting at least 3 cores and performing frequency-swept Φ-OTDR strain variation measurements simultaneously, local bending direction can be determined in the x-y-ε space geometrically, as shown in Fig. 16. Also, in the bending sensing experiments, temperature cross-sensitivity can be eliminated as all cores are subject to the same temperature variation. This method has the advantage of measuring bending curvature along the fiber with high sensitivity, but suffers from the high computational complexity.
Figure 16.(a) Cross section of the MCF. The circled fiber cores were selected for bending direction analysis. (b) Fiber bending direction analysis in the x-y-ε space. The x-yplane corresponds to one cross section of the MCF. Figure reproduced from ref.181, under the OSA Open Access Publishing Agreement.
With frequency-swept Φ-OTDR, M. Soto et al. proposed a distributed fiber birefringence measurement system35. In this case, Φ-OTDR measurements were performed at the slow and fast axes of a polarization-maintaining fiber respectively. In order to obtain the local birefringence ∆n, cross-correlation curve was calculated between local Rayleigh spectra of the slow and fast axes. The Rayleigh spectra shift ∆υ was found to be proportional to ∆n. The birefringence measurement of 3 km long single mode fiber was also demonstrated by the authors. The probing pulses were launched at two orthogonal polarization states as well, and ∆υ was retrieved corresponding to the 1st side peaks of the correlation curves instead of the main peak in this case. High birefringence resolution (~10–7) was achieved by this method.
In 2019, S. Mikhailov et al. utilized this approach to measure the hydrostatic pressure along a highly birefringent photonic crystal fiber (PCF)180. The pressure applied on the asymmetric micro-structured fiber would cause an asymmetric strain in the fiber core, inducing a local birefringence variation. The induced birefringence change was linearly proportional to the applied pressure variation. Hence, the frequency-swept Φ-OTDR approach can be utilized at the fast and slow axes to retrieve the local Rayleigh spectra correlation peak shift ∆υ, in order to sense the local hydrostatic pressure change. Pressure measurement resolution of 0.22 bar and 0.59 bar and sensitivity of 219 MHz/bar and 95.4 MHz/bar were demonstrated for two PCFs with different structures respectively.
Frequency-swept Φ-OTDR requires a step by step frequency scanning operation, which increases the measurement time of the system. To address this drawback, J. Pastor-Graells et al. replaced the frequency scanning operation with a single linearly chirped pulse to realize single-shot measurement37. The proposed chirped-pulse Φ-OTDR operates under very similar principle as the frequency-swept Φ-OTDR. The strain or temperature induced local refractive index change ∆n can be compensated by a temporally shifted region of the chirped pulse, leading to a longitudinal shift ∆zof the same Rayleigh temporal trace compared to the reference trace. The longitudinal shift ∆z was calculated by using a moving window of cross-correlation between two consecutive Rayleigh temporal traces. Because of the linear relation between ∆n and ∆z, ∆n was then easily obtained and used to further determine the strain or temperature variations. Preliminary results of temperature, strain and vibration sensing were presented. In the vibration measurement experiment, the system was able to reach 4 kHz acquisition rate over 1 km fiber length.
Multiple novel applications based on chirped-pulse Φ-OTDR were reported over recent years. Distributed sensing of gas presence was achieved in a micro-structured fiber with chirped-pulse Φ-OTDR176. A pump laser tuned to the acetylene absorption wavelength was launched into the sensing fiber. Its evanescent field would be absorbed and heat up the acetylene gas outside the core of the micro-structured fiber. Then a chirped-pulse Φ-OTDR was utilized to facilitate distributed temperature sensing along the fiber. Thus, by translating the acetylene presence into the temperature rise of the fiber material, proof of concept experiments of distributed gas sensing were presented.
In 2019, A. Garcia-ruiz et al. reported a distributed sensing system for hydrogen and deuterium concentration level with single mode fiber177. Chirped-pulse Φ-OTDR was used to detect the local refractive index change induced by hydrogen or deuterium molecules diffusing into the fiber core. One section of standard single mode fiber was used as the sensing fiber, while two sections of hermetic material coated fiber were used as reference to eliminate the temperature cross-sensitivity errors. The experiments were conducted under high pressure (150 bars for hydrogen and 100 bars for deuterium) for a period of more than 500 hours, so that the fiber core could reach its diffusion saturation level in the gas loading stage and return back to original state in the desorption stage. The refractive index temporal evolution was recorded by the chirped-pulse Φ-OTDR during this period. Based on the linear relation between the refractive index change at saturation state and the hydrogen concentration level205, a sensitivity to hydrogen of 10–3 mol/m3 was obtained in the experiment. However, the diffusion time of the gas molecule is too long, and the pressure, refractive index and solubility of the gas would all affect the linear coefficient, limiting the possible range of application to very specific scenarios.
By translating the solar irradiance to temperature change of the sensing fiber, distributed solar irradiance sensing system was proposed based on chirped-pulse Φ-OTDR179, 183. One black-painted fiber with high solar irradiance absorption rate was adopted as the sensing fiber, while another standard fiber with low absorption rate was used as reference, as shown in Fig. 17(a). Temperature measurements based on chirped-pulse Φ-OTDR was conducted in sensing and reference fiber simultaneously. As shown in Fig. 17(b), the local temperature difference between the two fibers was linearly proportional to the solar irradiance level, and the corresponding linear coefficient was obtained by applying known solar irradiance prior to experiments. A linear coefficient of 53/14 Wm–2K–1 was obtained, which corresponds to 0.06 W/m2 solar irradiance measurement resolution for their Φ-OTDR configuration. This method is capable of monitoring solar irradiance over long distance, but the response time of fiber material temperature reaching thermal equilibrium under sunlight exposure could be several minutes. With future improvements, this method is potentially useful in solar power plants for better grid management.
Figure 17.(a) Operation principle of the Φ-OTDR based solar irradiance sensing system. (b) Temperature difference between the black and reference fiber vs. the applied solar irradiance. Figure reproduced from ref.183, under a Creative Commons Attribution 4.0 International License.
In this paper, we have reviewed the recent developments of Φ-OTDR technique. The principles of DVS-Φ-OTDR and DAS-Φ-OTDR, as well as the phase demodulation methods for the rear one, are briefly introduced. Various methods for enhancing the sensing performance of Φ-OTDR system are introduced in detail, including improving the sensing distance, SNR, spatial resolution, frequency response range and event discrimination ability. In addition, we have analyzed various Φ-OTDR application cases in scenarios such as geological exploration, transportation, perimeter monitoring and partial discharge. The recent advancements in both Φ-OTDR performance enhancement and practical implementations proved its great potential. Future researches may focus on improvements of Φ-OTDR operation principles, advanced data interpretation methods and extending its application areas. For operation principles, the development of special fibers such as uwFBG array, few-mode fiber, scattering-enhanced fiber or multi-core fiber, may shed new light on the performance of Φ-OTDR. For data interpretation methods, it may be an effective way to refer to the advanced signal processing methods from artificial intelligence and computer science. In particular, it is necessary to verify the data interpretation method in practical engineering applications which are very different from experimental conditions. Moreover, Φ-OTDR is expected to be applied in more applications, such as locating the persons underground or the aircraft on the air, measuring the deformation of object, and so on.
References
[73] Papp A, Wiesmeyr C, Litzenberger M, Garn H, Kropatsch W. A real-time algorithm for train position monitoring using optical time-domain reflectometry. In IEEE International Conference on Intelligent Rail Transportation (ICIRT) 83–93 (IEEE, 2016); http://doi.org/10.1109/icirt.2016.7588715.
[74] Cao C, Fan XY, Liu QW, He ZY. Practical pattern recognition system for distributed optical fiber intrusion monitoring system based on phase-sensitive coherent OTDR. In Asia Communications and Photonics Conference 2015 ASu2A. 145 (OSA, 2015); http://doi.org/10.1364/ACPC.2015.ASu2A.145.
[79] Wen HQ, Peng ZQ, Jian JN, Wang MH, Liu H et al. Artificial intelligent pattern recognition for optical fiber distributed acoustic sensing systems based on phase-OTDR. In 2018 Asia Communications and Photonics Conference 1–4 (IEEE, 2018); http://doi.org/10.1109/ACP.2018.8595809.
[80] Mestayer J, Cox B, Wills P, Kiyashchenko D, Lopez J et al. Field trials of distributed acoustic sensing for geophysical monitoring. In SEG Technical Program Expanded Abstracts 2011 4253–4257 (Society of Exploration Geophysicists, 2011); http://doi.org/10.1190/1.3628095.
[82] Molenaar MM, Fidan E, Hill DJ. Real-time downhole monitoring of hydraulic fracturing treatments using fibre optic distributed temperature and acoustic sensing. In SPE/EAGE European Unconventional Resources Conference and Exhibition (Society of Exploration Geophysicists, 2012); http://doi.org/10.2118/152981-MS.
[83] Mateeva A, Mestayer J, Cox B, Kiyashchenko D, Wills P et al. Advances in Distributed Acoustic Sensing (DAS) for VSP. In SEG Technical Program Expanded Abstracts 2012 1–5 (Society of Exploration Geophysicists, 2012); http://doi.org/10.1190/segam2012-0739.1.
[85] Molenaar MM, Cox BE. Field cases of hydraulic fracture stimulation diagnostics using fiber optic Distributed Acoustic Sensing (DAS) measurements and analyses. In SPE Unconventional Gas Conference and Exhibition (Society of Petroleum Engineers, 2013); http://doi.org/10.2118/164030-MS.
[86] Finfer DC, Mahue V, Shatalin SV, Parker TR, Farhadiroushan M. Borehole flow monitoring using a non-intrusive passive Distributed Acoustic Sensing (DAS). In SPE Annual Technical Conference and Exhibition (Society of Petroleum Engineers, 2014); http://doi.org/10.2118/170844-MS.
[90] Hornman K, Kuvshinov B, Zwartjes P, Franzen A. Field trial of a broadside-sensitive distributed acoustic sensing cable for surface seismic. In 75th EAGE Conference & Exhibition incorporating SPE EUROPEC (European Association of Geoscientists & Engineers, 2013);http://doi.org/10.3997/2214-4609.20130383.
[115] Cedilnik G, Hunt R, Lees G. Advances in train and rail monitoring with DAS. In 26th International Conference on Optical Fiber Sensors ThE35 (SPIE, 2018);http://doi.org/10.1364/OFS.2018.ThE35.
[130] Uyar F, Onat T, Unal C, Kartaloglu T, Ozdur I et al. 94.8 Km-range direct detection fiber optic distributed acoustic sensor. In Conference on Lasers and Electro-Optics AF1K. 7 (OSA, 2019); http://doi.org/10.1364/CLEO_AT.2019.AF1K.7.
[132] Zhang JD, Zheng H, Zhu T, Yin GL, Liu M et al. Long range fading free phase-sensitive reflectometry based on multi-tone NLFM pulse. In 26th International Conference on Optical Fiber Sensors TuC3 (OSA, 2018);http://doi.org/10.1364/OFS.2018.TuC3.
[155] He Q, Liu R, Tan CD, Tang LJ, Shang XJ. The detection of non-Gaussian vibrations with improved spatial resolution and signal-to-noise ratio in distributed sensing. arXiv preprint arXiv: 1901.05846 (2019).
[158] Lu B, Zheng HR, Wang ZY, Ye Q, Wei F et al. High spatial resolution Φ-OTDR with long sensing distance. In 26th International Conference on Optical Fiber Sensors ThE25 (OSA, 2018); http://doi.org/10.1364/OFS.2018.ThE25.
[188] Owen A, Duckworth G, Worsley J. OptaSense: fibre optic distributed acoustic sensing for border monitoring. In 2012 European Intelligence and Security Informatics Conference 362-364 (IEEE, 2012); http://doi.org/10.1109/eisic.2012.59.
[190] Hill D. Distributed Acoustic Sensing (DAS): theory and applications. In Frontiers in Optics 2015 FTh4E. 1 (OSA, 2016); http://doi.org/10.1364/FIO.2015.FTh4E.1.
[194] Aziz W, Arif M. Multiscale permutation entropy of physiological time series. In 2005 Pakistan Section Multitopic Conference 1–6 (IEEE, 2005); http://doi.org/10.1109/INMIC.2005.334494.
[195] Chen YP, Li JN, Xiao HX, Jin XJ, Yan SC et al. Dual path networks. In Proceedings of the 31st Conference on Neural Information Processing Systems 4470–4478 (ACM, 2017); http://doi.org/10.5555/3294996.3295200