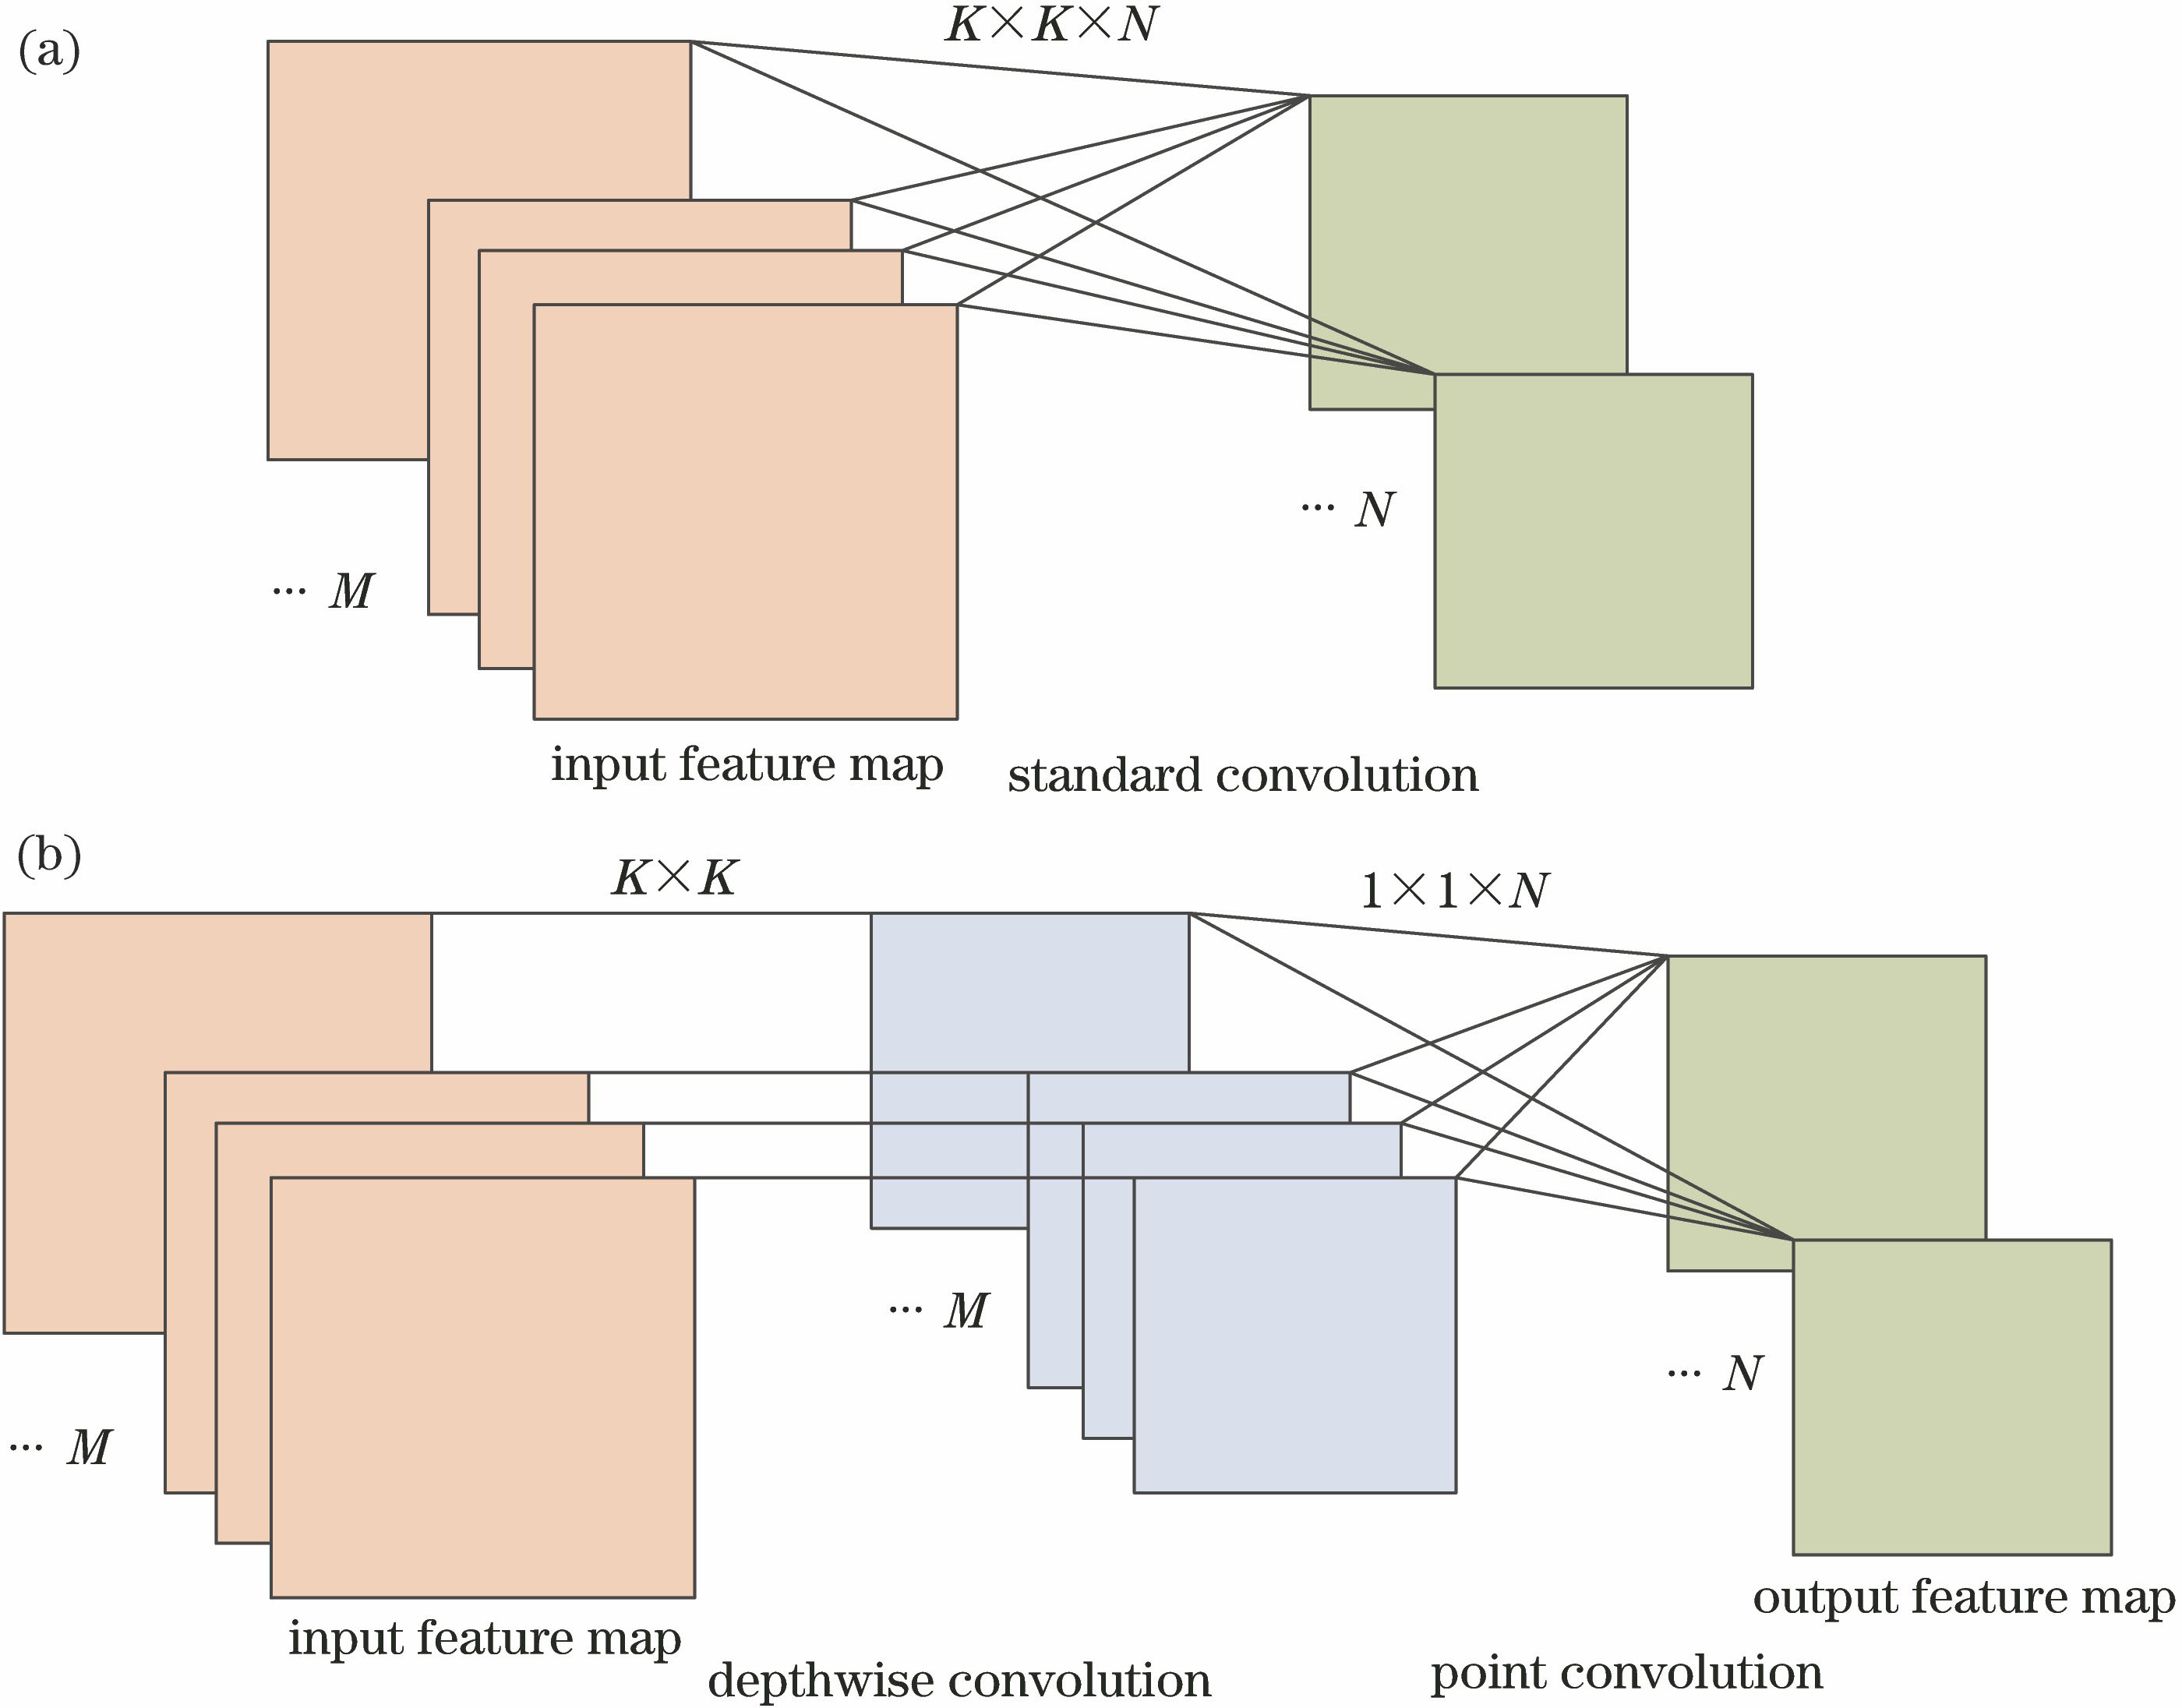
Fig. 1. Decoupling process of the depth separable convolution. (a) Standard convolution; (b) depth separable convolution
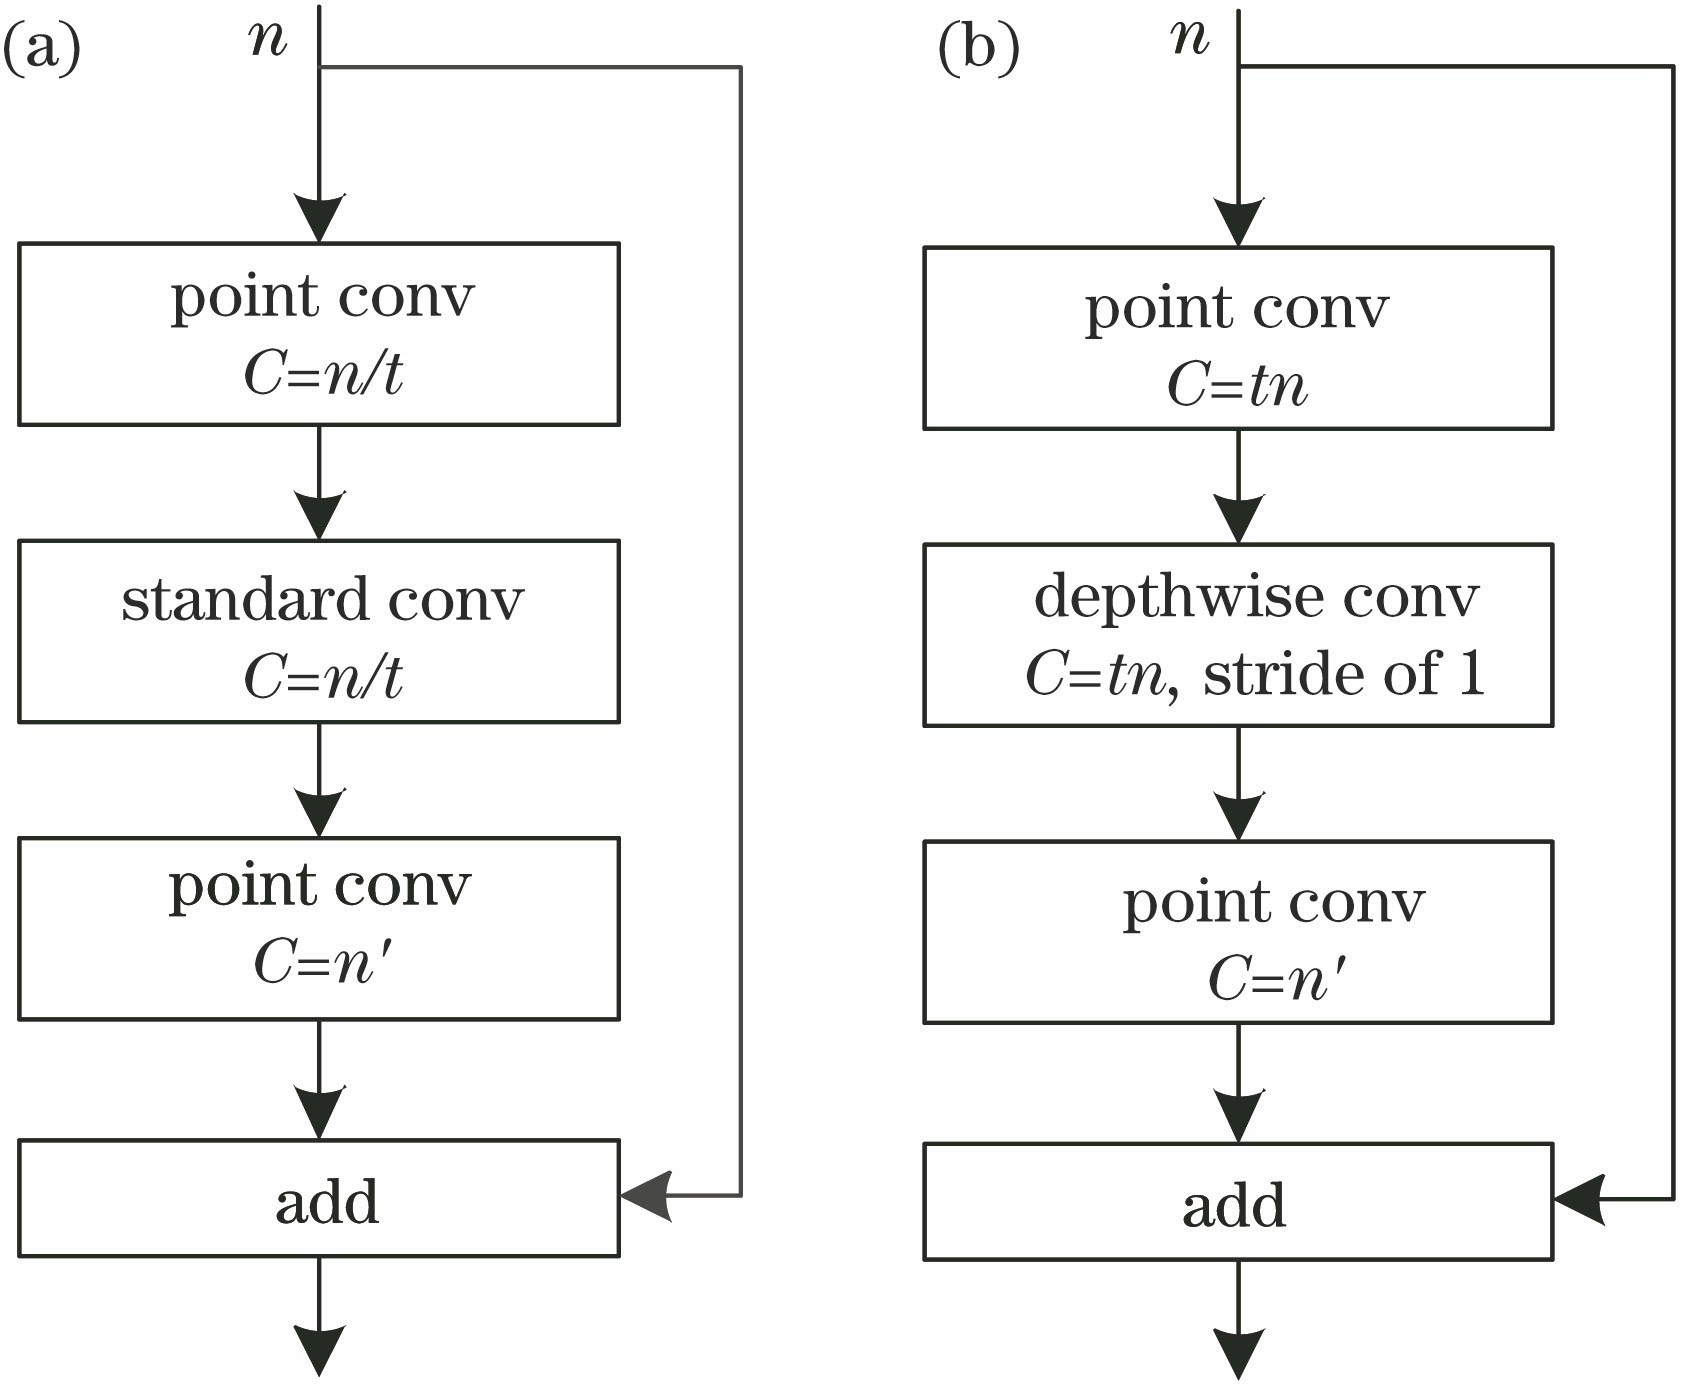
Fig. 2. Residual block and inverted residual block. (a) Residual block; (b) inverted residual block when stride is 1
Fig. 3. IR-YOLO network architecture
Fig. 4. Train loss curves
Fig. 5. Class detection accuracy histogram
Fig. 6. Comparison of detection results. (a)(d) Original input images ; (b)(e) detection results with YOLOv3-Tiny Model; (c)(f) detection results with IR-YOLO Model
Input | Operation | Output |
---|
h×w×k | 1×1 pointconv, ReLU | h×w×2k | h×w×2k | 3×3/sdepth conv, ReLU | × ×2k | × ×2k | 1×1 pointconv, linear | × ×2k |
|
Table 1. Parameters of inverted residual block
Category | Train set | Test set |
---|
Aeroplane | 1171 | 285 | Bicycle | 1064 | 337 | Bird | 1605 | 459 | Boat | 1140 | 263 | Bottle | 1764 | 469 | Bus | 822 | 213 | Car | 3267 | 1201 | Cat | 1593 | 358 | Chair | 3152 | 756 | Cow | 847 | 244 | Dining table | 824 | 206 | Dog | 2025 | 489 | Horse | 1072 | 348 | Motor bike | 1052 | 325 | Person | 13256 | 4528 | Potted plant | 1487 | 480 | Sheep | 1070 | 242 | Sofa | 814 | 239 | Train | 925 | 282 | TV monitor | 1108 | 308 | Total | 40058 | 12032 |
|
Table 2. VOC dataset
Parameters name | Value |
---|
Batch | 64 | Momentum | 0.9 | Weight decay | 0.0005 | Learning rate | 0.001 |
|
Table 3. Hyper parameters
Input | Output | Number of floatingpoint operations instandard conv /109 | Number of floating pointoperations in inverted residual block /109 |
---|
Expand point conv | Depth conv | Squeeze point conv |
---|
208×208×16 | 208×208×32 | 0.399 | 0.044 | 0.025 | 0.089 | 104×104×32 | 104×104×64 | 0.399 | 0.044 | 0.012 | 0.089 | 52×52×64 | 52×52×128 | 0.399 | 0.044 | 0.006 | 0.089 | 26×26×128 | 26×26×256 | 0.399 | 0.044 | 0.003 | 0.089 | 13×13×256 | 13×13×512 | 0.399 | 0.044 | 0.002 | 0.089 | 13×13×512 | 13×13×1024 | 1.595 | 0.177 | 0.003 | 0.354 |
|
Table 4. Comparison on number of floating point operations
Model | CPU speed /(frame·s-1) | GPU speed /(frame·s-1) |
---|
YOLOv3-Tiny | 1.2 | 31.3 | IR-YOLO | 1.7 | 31.2 |
|
Table 5. Comparison detection speed of IR-YOLO model and YOLOv3-Tiny model
Trainingnumber | YOLOv3-TinymAP /% | IR-YOLOmAP /% |
---|
65000 | 45.15 | 43.33 | 75000 | 45.60 | 44.37 | 85000 | 45.17 | 45.23 | 90000 | 42.75 | 44.20 | 95000 | 42.76 | 46.07 |
|
Table 6. Comparison mAP of different training numbers
Category | YOLOv3-Tiny | IR-YOLO |
---|
Aeroplane | 54.78 | 56.38 | Bicycle | 60.79 | 57.86 | Bird | 27.24 | 28.19 | Boat | 27.9 | 28.92 | Bottle | 14.8 | 17.58 | Bus | 56.98 | 58.48 | Car | 63.8 | 64.05 | Cat | 50.39 | 53.57 | Chair | 25.77 | 23.25 | Cow | 46.43 | 45.48 | Dining table | 39.66 | 45.48 | Dog | 46.09 | 45.68 | Horse | 66.62 | 62.45 | Motor bike | 64.09 | 62.85 | Person | 59.23 | 59.4 | Potted plant | 18.22 | 17.22 | Sheep | 47.57 | 44.68 | Sofa | 39.39 | 43.11 | Train | 54.02 | 58.25 | TV monitor | 50.34 | 48.62 | mAP | 45.60 | 46.07 |
|
Table 7. Comparison of detection results of IR-YOLO and YOLOv3-Tiny on VOC dataset%