• Spectroscopy and Spectral Analysis
  • Vol. 41, Issue 8, 2511 (2021)
Hai-bo SUN*, Hai-long WU*;, An-qi CHEN, and Xiao-dong SUN
Author Affiliations
  • State Key Laboratory of Chemo/Biosensing and Chemometrics, College of Chemistry and Chemical Engineering, Hunan University, Changsha 410082, China
  • show less
    DOI: 10.3964/j.issn.1000-0593(2021)08-2511-07 Cite this Article
    Hai-bo SUN, Hai-long WU, An-qi CHEN, Xiao-dong SUN. Determination of Thiabendazole and Bisphenol A in Environmental Water Samples Using Excitation-Emission Matrix Fluorescence Coupled With Chemical Multi-Way Calibration Method[J]. Spectroscopy and Spectral Analysis, 2021, 41(8): 2511 Copy Citation Text show less
    The chemical structure formulas of thiabendazole and bisphenol A
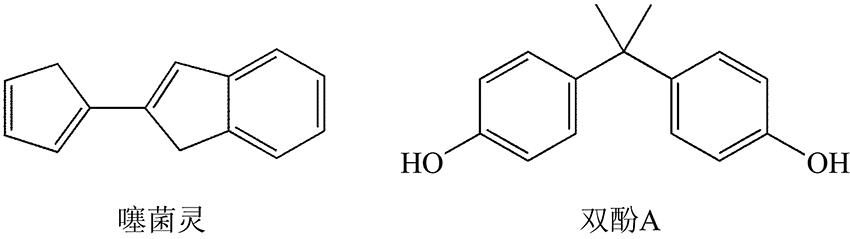
    Fig. 1. The chemical structure formulas of thiabendazole and bisphenol A
    The flow chart of excitation-emission matrix fluorescence coupled with ATLD algorithm
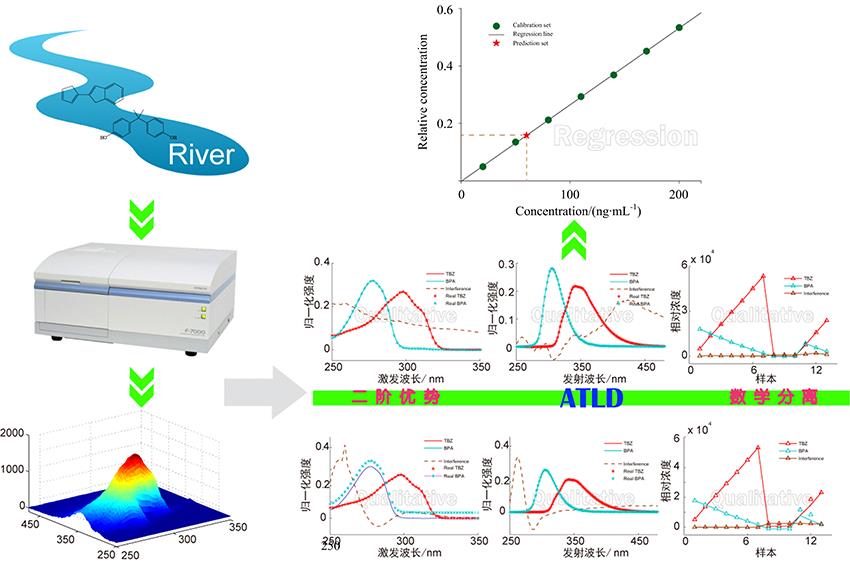
    Fig. 2. The flow chart of excitation-emission matrix fluorescence coupled with ATLD algorithm
    The excitation-emission matrix fluorescence spectra(a): A calibration sample C04; (b): A blank water sample P00 of Taozihu Lake; (c): A blank water sample Q00 of the Xiangjiang River; (d): A prediction water sample Q02 of the Xiangjiang River
    Fig. 3. The excitation-emission matrix fluorescence spectra
    (a): A calibration sample C04; (b): A blank water sample P00 of Taozihu Lake; (c): A blank water sample Q00 of the Xiangjiang River; (d): A prediction water sample Q02 of the Xiangjiang River
    The normalized excitation profiles (a1, a2), normalized emission profiles (b1, b2) and relative concentration profiles (c1, c2) of lake and river samples resolved by ATLD algorithm
    Fig. 4. The normalized excitation profiles (a1, a2), normalized emission profiles (b1, b2) and relative concentration profiles (c1, c2) of lake and river samples resolved by ATLD algorithm
    样本浓度/(ng·mL-1)桃子湖
    水样/mL
    湘江水样
    /mL
    噻菌灵双酚A
    C0120.00280.00
    C0250.00240.00
    C0380.00200.00
    C04110.00160.00
    C05140.00120.00
    C06170.0080.00
    C07200.0040.00
    P005.0
    P0130.00150.005.0
    P0260.00100.005.0
    P0390.0050.005.0
    Q005.0
    Q0130.00150.005.0
    Q0260.00100.005.0
    Q0390.0050.005.0
    Table 1. The designed concentrations of TBZ and BPA in calibration set and prediction set
    样本添加值/(ng·mL-1)预测值/(ng·mL-1)回收率/%
    TBZBPATBZBPATBZBPA
    P0130.00150.029.66135.898.990.5
    P0260.00100.055.5887.3692.687.4
    P0390.0050.0087.5946.0797.392.1
    平均回收率±标准偏差/%96.3±3.290.0±2.4
    Q0130.00150.029.22129.897.486.5
    Q0260.00100.060.0086.70100.086.7
    Q0390.0050.0089.8249.5899.899.2
    平均回收率±标准偏差/%99.1±1.490.8±7.2
    Table 2. The prediction and recovery results of TBZ and BPA for lake and river samples
    品质因子选择性
    SEL
    灵敏度SEN/
    (mL·ng-1)
    检测限LOD/
    (ng·mL-1)
    定量限LOQ/
    (ng·mL-1)
    湖水
    TBZ0.76199.380.070.22
    BPA0.7450.360.651.97
    河水
    TBZ0.55147.230.250.75
    BPA0.6644.210.190.59
    Table 3. Analytical figures of merit of TBZ and BPA in lake and river samples obtained by ATLD algorithm
    分析手段预处理方法分析物检测限回收率文献
    高效液相色谱-紫外检测器磁性固相萃取BPA3.05 ng·mL-186%~99%[17]
    高效液相色谱-荧光检测器磁性分子印迹固相萃取法BPA0.3 μg·mL-172%~113%[18]
    高效液相色谱-荧光检测器分子印迹固相萃取法BPA1.32 μg·mL-186%~111%[19]
    三维荧光光谱/TBZ4 ng·mL-179%~128%[20]
    同步荧光法/TBZ0.17 ng·mL-199%~103%[21]
    三维荧光光谱/BPA
    TBZ
    0.07~0.25 ng·mL-1
    0.19~0.65 ng·mL-1
    87%~99%
    93%~100%
    本工作
    Table 4. Comparison of the present work with other methods for determination of BPA and TBZ
    Hai-bo SUN, Hai-long WU, An-qi CHEN, Xiao-dong SUN. Determination of Thiabendazole and Bisphenol A in Environmental Water Samples Using Excitation-Emission Matrix Fluorescence Coupled With Chemical Multi-Way Calibration Method[J]. Spectroscopy and Spectral Analysis, 2021, 41(8): 2511
    Download Citation