
Lei Zhang, Xiuzhen Han, Fuzhong Weng, Zhongfeng Qiu. Comparison of Water Information Extraction Algorithms Based on Sentinel-2A MSI Data[J]. Laser & Optoelectronics Progress, 2022, 59(12): 1228007
- Laser & Optoelectronics Progress
- Vol. 59, Issue 12, 1228007 (2022)
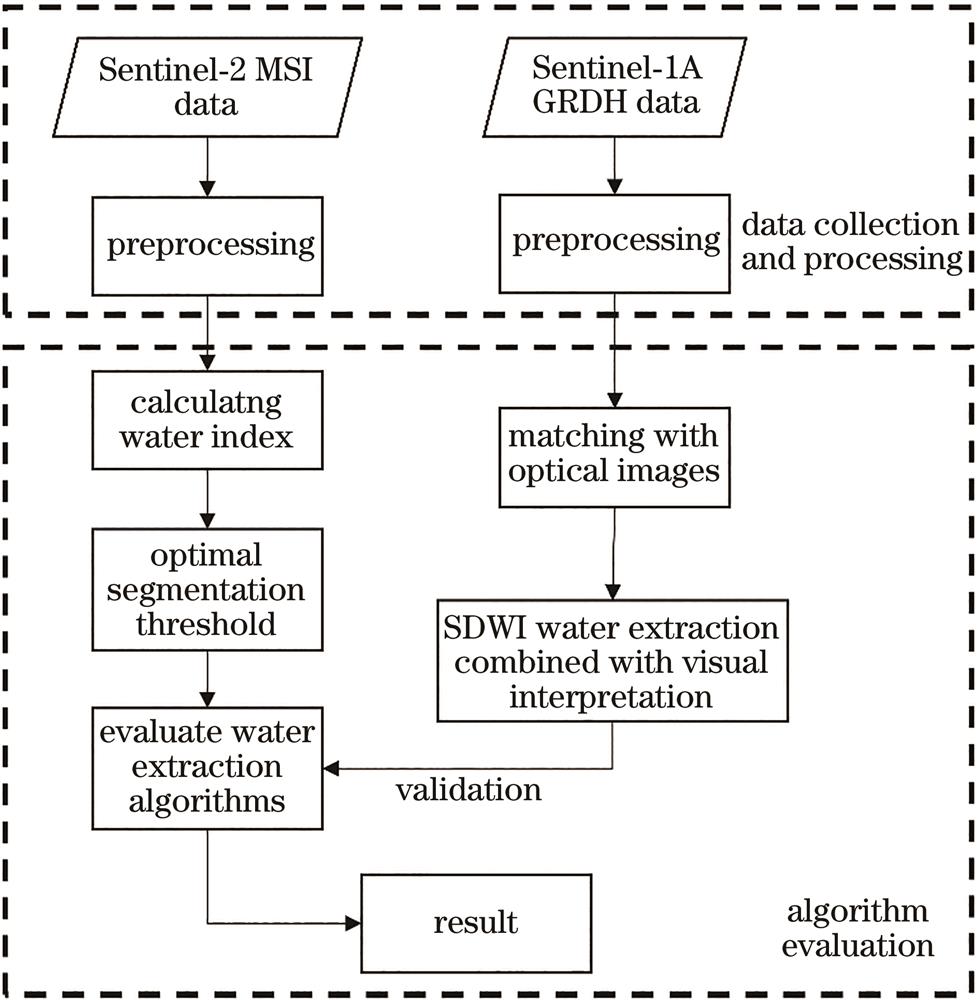
Fig. 1. Technology roadmap
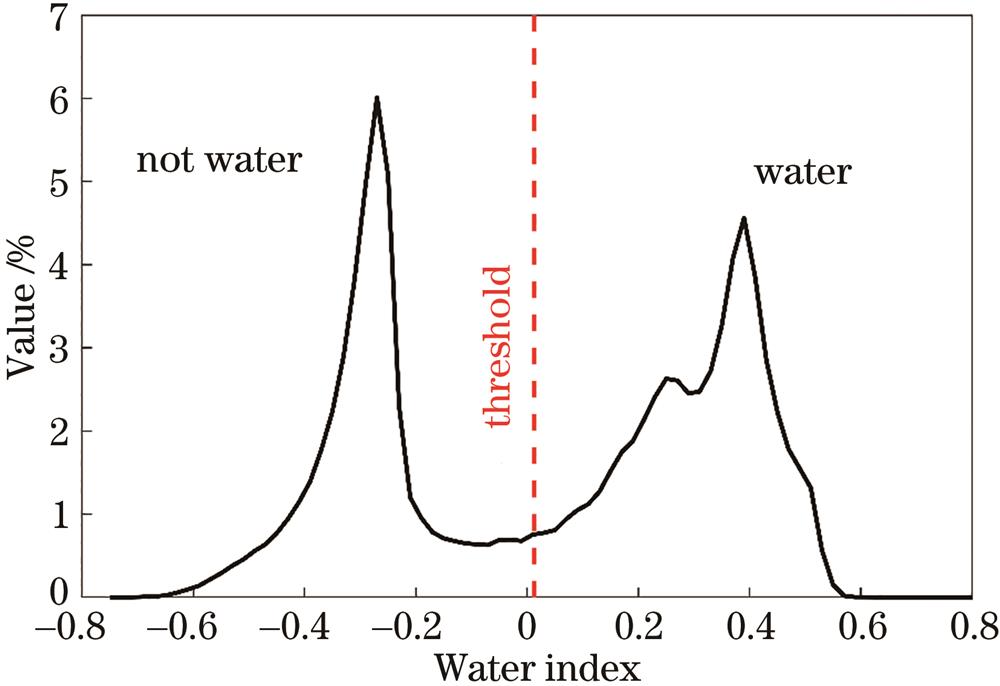
Fig. 2. Schematic diagram of determining optimal segmentation threshold based on Otsu (shown by dotted abscissa)
Fig. 3. Comparison of extraction effects of 10 band index in different experimental areas
Fig. 4. F1-score of water identification results of all water index in different areas. (a) Mountain; (b) lake; (c) paddy field; (d) town; (e) river
Fig. 5. False alarm rate and dismissal alarm rate of water identification results of all water index in different areas. (a) Mountain; (b) lake; (c) paddy field; (d) town; (e) river
Fig. 6. Average accuracy indexes of each model in different regions. (a) F1-Score; (b) false alarm rate and dismissal alarm rate
Fig. 7. Display of recognition effect of each index for land and water boundary. (a) Paddy field area, rectangular box as main research area; (b) false color composite map of research area; (c)-(l) water body recognition results corresponding to each index model
Fig. 8. Identification accuracy of each index in mixed area of land and water. (a) F1-score; (b) false alarm rate; (c) dismissal alarm rate
Fig. 9. Variation of reflectance of different land features with Sentinel-2A MSI band
| |||||||||||
Table 1. Confusion matrix
|
Table 2. Threshold and standard deviation of water index model

Set citation alerts for the article
Please enter your email address
© Copyright 2018-2021 | Chinese Laser Press. All Rights Reserved 沪ICP备15018463号-20