• Chinese Optics Letters
  • Vol. 19, Issue 6, 060013 (2021)
Yuechen Jia1、*, Yingying Ren2, Xingjuan Zhao1, and Feng Chen1、**
Author Affiliations
  • 1School of Physics, State Key Laboratory of Crystal Materials, Shandong University, Jinan 250100, China
  • 2Shandong Provincial Engineering and Technical Center of Light Manipulations & Shandong Provincial Key Laboratory of Optics and Photonic Device, School of Physics and Electronics, Shandong Normal University, Jinan 250014, China
  • show less
    DOI: 10.3788/COL202119.060013 Cite this Article Set citation alerts
    Yuechen Jia, Yingying Ren, Xingjuan Zhao, Feng Chen. Surface lattice resonances in dielectric metasurfaces for enhanced light-matter interaction [Invited][J]. Chinese Optics Letters, 2021, 19(6): 060013 Copy Citation Text show less
    (a) Schematic representation of a single LiNbO3 nanoparticle used in this work. (b) Side profile of the nanoparticle with a height of h, a length and width of d, and a side-wall angle of θ. The x, y, and z axis orientations represent the LiNbO3 crystalline axes.
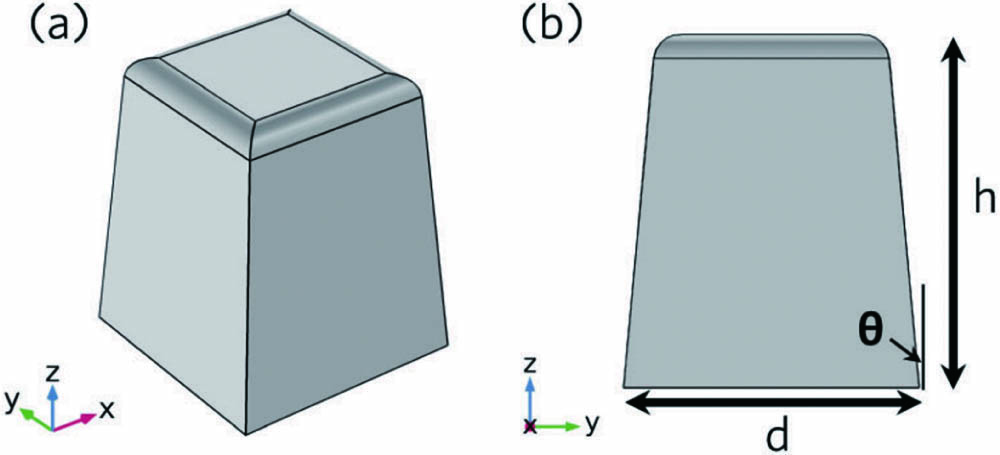
    Fig. 1. (a) Schematic representation of a single LiNbO3 nanoparticle used in this work. (b) Side profile of the nanoparticle with a height of h, a length and width of d, and a side-wall angle of θ. The x, y, and z axis orientations represent the LiNbO3 crystalline axes.
    (a) Simulated scattering cross section and electric field enhancement of an on-chip LiNbO3 nanoparticle (d = 800 nm, h = 960 nm, θ = 5°) with a SiO2 substrate and air superstrate. The spatial distributions of the normalized (b), (d) electric field intensity and (c), (e) magnetic field intensity for the (b), (c) ED and the (d), (e) MD resonances. The color scales represent the field intensity, and the black arrows represent the real part of the vectorial (c) magnetic and (d) electric field projected in the (c) yz and (d) xz plane, respectively.
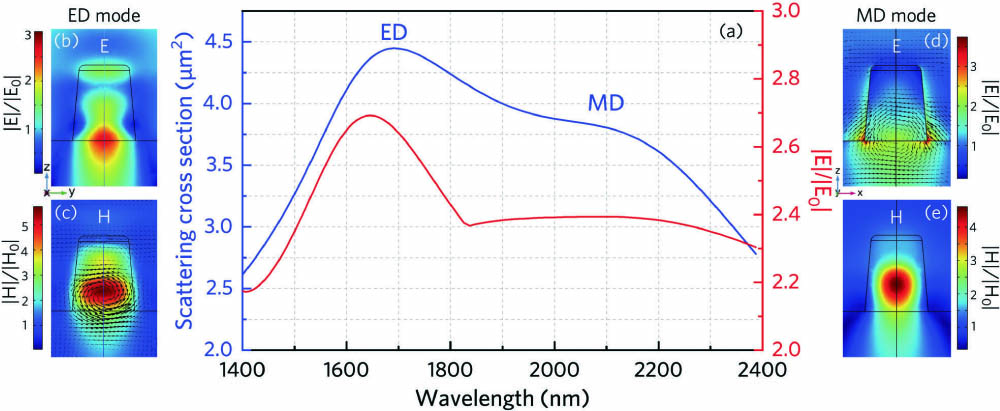
    Fig. 2. (a) Simulated scattering cross section and electric field enhancement of an on-chip LiNbO3 nanoparticle (d = 800 nm, h = 960 nm, θ = 5°) with a SiO2 substrate and air superstrate. The spatial distributions of the normalized (b), (d) electric field intensity and (c), (e) magnetic field intensity for the (b), (c) ED and the (d), (e) MD resonances. The color scales represent the field intensity, and the black arrows represent the real part of the vectorial (c) magnetic and (d) electric field projected in the (c) yz and (d) xz plane, respectively.
    COMSOL simulations of (a) scattering cross section and (b) electric field enhancement of arrayed LiNbO3 nanoantennas with lattice period from 900 nm to 1600 nm. The maximum electric field enhancement positions for ED and MD modes are marked in the figures, labeled as ED-SLR and MD-SLR, respectively.
    Fig. 3. COMSOL simulations of (a) scattering cross section and (b) electric field enhancement of arrayed LiNbO3 nanoantennas with lattice period from 900 nm to 1600 nm. The maximum electric field enhancement positions for ED and MD modes are marked in the figures, labeled as ED-SLR and MD-SLR, respectively.
    COMSOL simulations of RA-engineered MD and ED modes at their maximum electric field enhancement positions (with lattice periods of 1425 nm and 925 nm). (a) Simulated scattering cross section and electric field enhancement of MD-SLR resonance and the spatial distributions of the normalized (b) electric field intensity and (c) magnetic field intensity at the maximum field enhancement position. (d) Simulated scattering cross section and electric field enhancement of ED-SLR resonance and the spatial distributions of the normalized (e) electric field intensity and (f) magnetic field intensity at the maximum field enhancement position. The color scale represents the magnetic and electric field intensity enhancements. The black arrows are the real components of the vectorial electric and magnetic fields.
    Fig. 4. COMSOL simulations of RA-engineered MD and ED modes at their maximum electric field enhancement positions (with lattice periods of 1425 nm and 925 nm). (a) Simulated scattering cross section and electric field enhancement of MD-SLR resonance and the spatial distributions of the normalized (b) electric field intensity and (c) magnetic field intensity at the maximum field enhancement position. (d) Simulated scattering cross section and electric field enhancement of ED-SLR resonance and the spatial distributions of the normalized (e) electric field intensity and (f) magnetic field intensity at the maximum field enhancement position. The color scale represents the magnetic and electric field intensity enhancements. The black arrows are the real components of the vectorial electric and magnetic fields.
    COMSOL simulations of electric field enhancements of (a) MD-SLR and (b) ED-SLR in arrayed LiNbO3 nanoantennas with side-wall angles tuning from 0° to 16°.
    Fig. 5. COMSOL simulations of electric field enhancements of (a) MD-SLR and (b) ED-SLR in arrayed LiNbO3 nanoantennas with side-wall angles tuning from 0° to 16°.
    Yuechen Jia, Yingying Ren, Xingjuan Zhao, Feng Chen. Surface lattice resonances in dielectric metasurfaces for enhanced light-matter interaction [Invited][J]. Chinese Optics Letters, 2021, 19(6): 060013
    Download Citation