• Chinese Optics Letters
  • Vol. 18, Issue 12, 121704 (2020)
Ting Feng1、2, Yunhao Zhu3, Yejing Xie1, Dean Ta4, Jie Yuan3、**, and Qian Cheng2、5、*
Author Affiliations
  • 1School of Electronic and Optical Engineering, Nanjing University of Science and Technology, Nanjing 210094, China
  • 2Institute of Acoustics, School of Physics Science and Engineering, Tongji University, Shanghai 200092, China
  • 3School of Electronic Science and Engineering, Nanjing University, Nanjing 210094, China
  • 4Department of Electronic Engineering, Fudan University, Shanghai 200433, China
  • 5Key Laboratory of Spine and Spinal Cord Injury Repair and Regeneration of Ministry of Education, Orthopaedic Department of Tongji Hospital, Tongji University School of Medicine, Shanghai 200065, China
  • show less
    DOI: 10.3788/COL202018.121704 Cite this Article Set citation alerts
    Ting Feng, Yunhao Zhu, Yejing Xie, Dean Ta, Jie Yuan, Qian Cheng. Feasibility study for bone health assessment based on photoacoustic imaging method[J]. Chinese Optics Letters, 2020, 18(12): 121704 Copy Citation Text show less
    (a) Experiment setup for studying light penetration in the bovine bone. (b) The light penetration through a 4-mm-thick bone as a function of the laser wavelength. (c) The PA signal of the line object, which was excited by the light transmitted through the bone with different bone thicknesses (6.7 mm to 22 mm). (d) Quantified signal to noise ratio (SNR) as a function of the optical penetration depth. The solid curve shows the exponential fitting following the equation of 92.0 × exp(−0.20 × l).
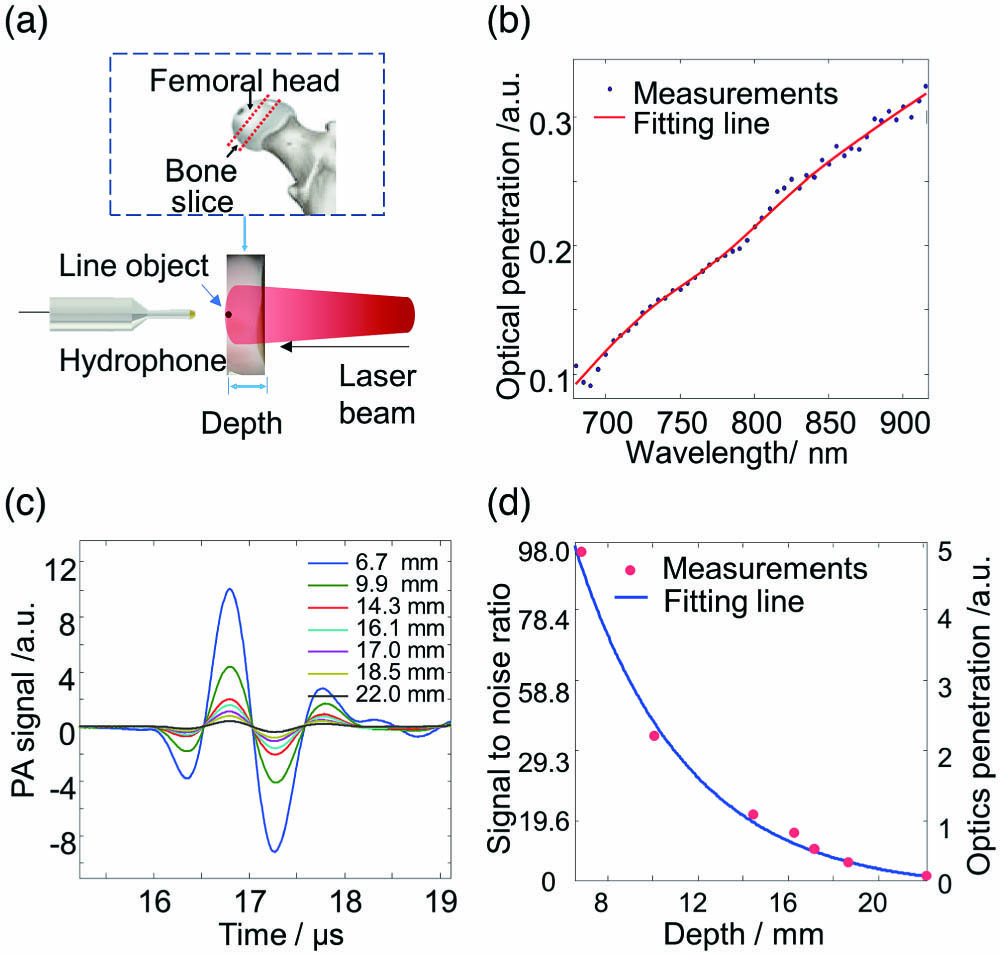
    Fig. 1. (a) Experiment setup for studying light penetration in the bovine bone. (b) The light penetration through a 4-mm-thick bone as a function of the laser wavelength. (c) The PA signal of the line object, which was excited by the light transmitted through the bone with different bone thicknesses (6.7 mm to 22 mm). (d) Quantified signal to noise ratio (SNR) as a function of the optical penetration depth. The solid curve shows the exponential fitting following the equation of 92.0 × exp(−0.20 × l).
    (a) Experiment setup for studying the US penetration in the bone. (b) The PA signals generated by a line object pass through bone samples with different bone thicknesses (6.7 mm to 22 mm). (c) The quantified SNR as a function of US penetration depth with the exponential fitting shown as a solid curve following the equation of 58.2 × exp(−0.33 × l).
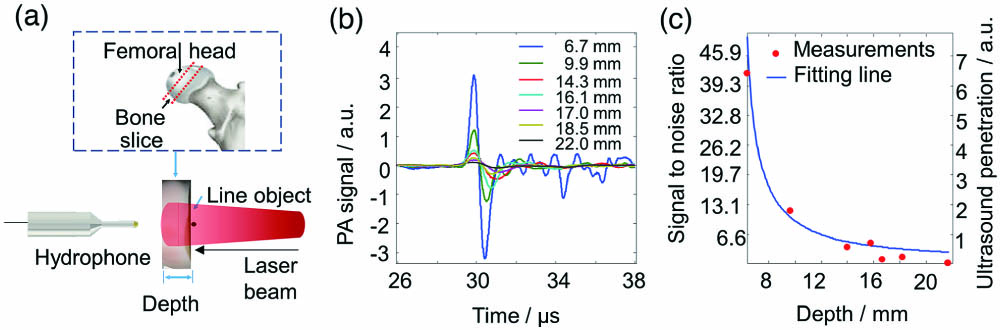
    Fig. 2. (a) Experiment setup for studying the US penetration in the bone. (b) The PA signals generated by a line object pass through bone samples with different bone thicknesses (6.7 mm to 22 mm). (c) The quantified SNR as a function of US penetration depth with the exponential fitting shown as a solid curve following the equation of 58.2 × exp(−0.33 × l).
    (a) Schematic diagram for transmission mode PA measurement of a bovine femoral head covered by 5 mm of soft tissue. (b) An example A-line PA signal from the bone. Based on the difference in time-of-flight, the signals from the trabeculae and the cortical and soft tissue can be separated, as marked by the red and the green boxes, respectively. (c) PSD of the PA signal from the trabeculae.
    Fig. 3. (a) Schematic diagram for transmission mode PA measurement of a bovine femoral head covered by 5 mm of soft tissue. (b) An example A-line PA signal from the bone. Based on the difference in time-of-flight, the signals from the trabeculae and the cortical and soft tissue can be separated, as marked by the red and the green boxes, respectively. (c) PSD of the PA signal from the trabeculae.
    (a) Schematic diagram of PA imaging of a bovine rib. (b) Example A-line PA signals from the bovine rib with and without the EDTA treatment. The cortical bone (CB) and trabecular bone (TB) could be distinguished based on the time-of-flight. (c) Binarized 3D PA imaging result of the bovine rib without EDTA treatment. (e) Binarized 3D PA imaging result of the bovine rib with EDTA treatment for 48 h. The quantified bone volume densities for the bone with and without EDTA treatment are 32% and 22%, respectively, for (c) and (e). Micro-CT images of the bovine rib (d) without and (f) with EDTA treatment.
    Fig. 4. (a) Schematic diagram of PA imaging of a bovine rib. (b) Example A-line PA signals from the bovine rib with and without the EDTA treatment. The cortical bone (CB) and trabecular bone (TB) could be distinguished based on the time-of-flight. (c) Binarized 3D PA imaging result of the bovine rib without EDTA treatment. (e) Binarized 3D PA imaging result of the bovine rib with EDTA treatment for 48 h. The quantified bone volume densities for the bone with and without EDTA treatment are 32% and 22%, respectively, for (c) and (e). Micro-CT images of the bovine rib (d) without and (f) with EDTA treatment.
    (a) Normalized PSD of PA signals generated from the bone with and without the EDTA treatment, respectively. The fitting line made is shown as the dotted line for each PSD in the spectral range within −20 dB. (b) Quantified PSD parameter slope from the bone with and without the EDTA treatment (p0.001). For each box, the median is shown as the central mark, the 25th and 75th percentiles are shown as the edges of the box, and the outliers are plotted separately.
    Fig. 5. (a) Normalized PSD of PA signals generated from the bone with and without the EDTA treatment, respectively. The fitting line made is shown as the dotted line for each PSD in the spectral range within −20 dB. (b) Quantified PSD parameter slope from the bone with and without the EDTA treatment (p<0.001). For each box, the median is shown as the central mark, the 25th and 75th percentiles are shown as the edges of the box, and the outliers are plotted separately.
    Ting Feng, Yunhao Zhu, Yejing Xie, Dean Ta, Jie Yuan, Qian Cheng. Feasibility study for bone health assessment based on photoacoustic imaging method[J]. Chinese Optics Letters, 2020, 18(12): 121704
    Download Citation