Abstract
This study investigated the feasibility of photoacoustic (PA) imaging of bone and characterization of bone features. By conducting the experiments on bovine femoral heads ex vivo, the light and ultrasonic penetration in bones was studied, together with the depth of PA imaging and measurement in bones. Then, the possibility of three-dimensional (3D) PA imaging of bones by raster scanning of the focusing transducer was studied. The micro-computerized tomography images of the bovine ribs with and without ethylenediaminetetraacetic acid (EDTA) treatment indicated that the 3D PA images could present the changes of bone microstructure resulting from the EDTA treatment. By using PA spectral analysis, the bone samples with and without the treatment of EDTA solution can be distinguished, and the microstructures can be characterized. This study was based on the bovine bone whose size is comparable to human bones, suggesting that PA technology can be used as a novel bone diagnostic technique.Osteoporosis is a highly prevalent disease, affecting approximately 40% of women and 20% of men over the age of 50 years[1,2]. Fragility fractures associated with osteoporosis result in significant individual and societal costs, so the early detection of changes in bone quality and quantity is crucial in reducing the clinical and economic burden of osteoporotic fractures. Recently, clinically used osteoporosis diagnostic techniques are mostly based on either the X ray or ultrasound (US). The gold-standard dual-energy X-ray absorptiometry (DEXA) cannot adequately describe the risk of fracture, and its accuracy is limited because it can only provide the bone mineral density (BMD) information, while the bone microarchitecture (BMA) and material properties associated with bone health cannot be evaluated. Quantitative ultrasound (QUS) assessment of bone health is based on the measurements of the broadband US attenuation (BUA) and speed of sound (SOS), which are highly sensitive to the BMD, but less correlated with BMA[3–6].
Photoacoustic (PA) technology has been developed rapidly and has been extensively explored in diagnostics for many diseases in the past decade[7–12]. Compared to the conventional US imaging, PA imaging has the advantage of highly sensitive light absorption contrast of tissue, so it can accurately assess molecular information in biological tissues. For potential applications on bone, the PA technique not only has the potential to measure parameters related to non-organic minerals (such as BMD and BMA), but also can measure the content and distribution of organic components (such as collagen, hemoglobin, and lipids). Therefore, PA technology gives an opportunity to obtain other molecular and biochemical biomarkers for osteoporosis and other bone diseases and provides new ideas for diagnostic and therapeutic evaluation. Compared with the diffuse optical techniques, PA measurement can be achieved with higher ultrasonic resolution, which can evaluate the characteristics of different positions within the same bone, such as the position between the cortical and trabecular, the diaphyseal, and the metaphyseal. In a prior study, the PA signal generated in bone contains not only microstructural information but also chemical and molecular information—both are highly relevant to bone health. Lashkari et al. assessed the changes in cortical and trabecular bone structure and density by using dual backscatter US and PA radar systems[13,14]. In addition, our group investigated the feasibility of using thermal PA and PA spectral analysis (PASA) to evaluate BMD and BMA of trabecular bone in rat models[15–17]. Recently, Steinberg et al. used the dual-modality multispectral PA system to quantify the blood/fat ratio present in marrow, which has been correlated with molecular changes in the long bone[18].
Before translating the PA technology to clinical application, the possibility of clinically relevant PA imaging and measurement needs to be studied on bones with the size equal to human bones. Based on the studies performed on bovine femoral heads ex vivo, we first studied light and ultrasonic penetration in bone and evaluated the imaging and measurement depths that can be achieved in reflection and transmission modes. Then, we studied the feasibility of 3D PA imaging on the bones by conducting a two-dimensional (2D) raster scan on bovine ribs with and without ethylenediaminetetracetic acid (EDTA) solution treatment. The feasibility to quantitatively evaluate the bone microstructure by performing PASA was also investigated.
Sign up for Chinese Optics Letters TOC. Get the latest issue of Chinese Optics Letters delivered right to you!Sign up now
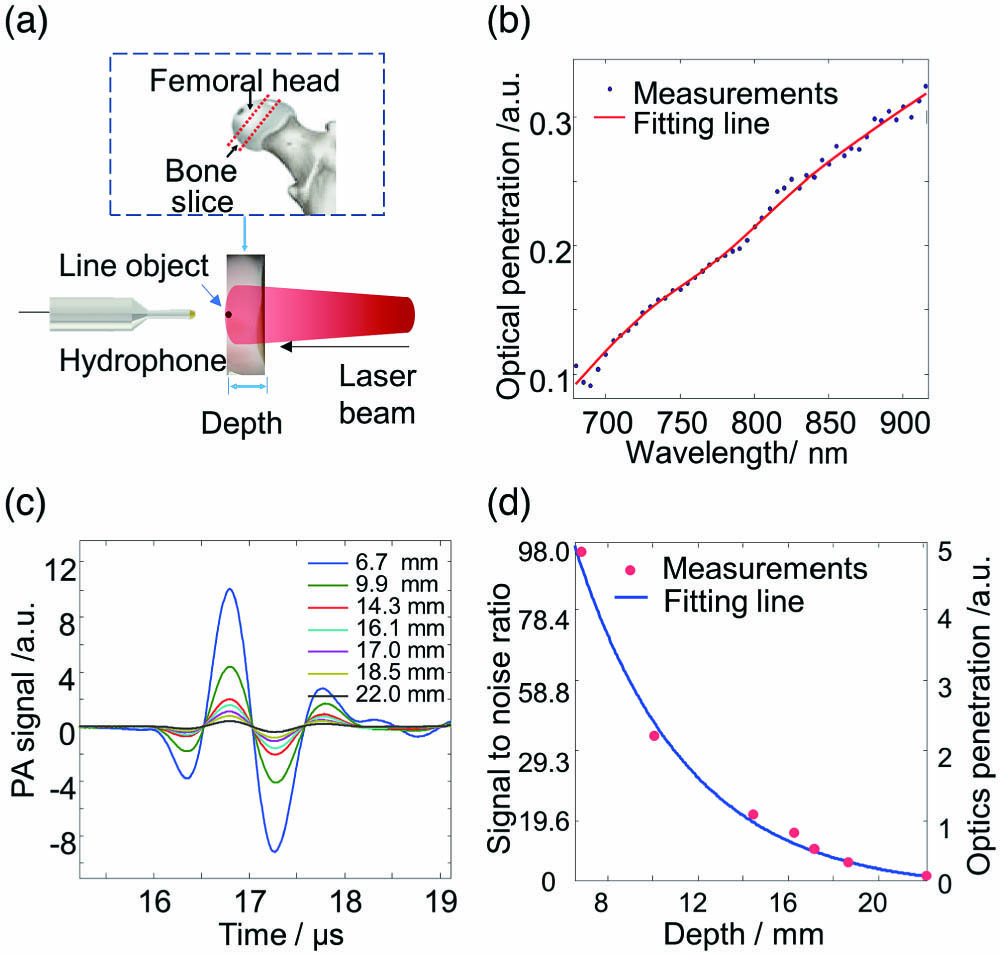
The experimental setup for the studies of light penetration in bones by using the transmission mode is shown in Fig. 1(a). As shown in the dashed box, the bovine femoral head was cut into thin slices (mainly combined by trabecula and bone marrow) with a thickness ranging from 6.7 mm to 22 mm. The light beam generated by a Nd:Y3Al5O12 (Nd:YAG) laser pumped optical parametric oscillator (OPO, Vibrant B, Opotek) illuminated the bone from one side on the surface of the bovine bone. The diameter of the beam is 4 mm, and the light fluence was controlled to be less than , which is well below the American National Standards Institute (ANSI) safety limit. A line-like object with high optical absorption and the diameter of ∼1 mm was placed on another side of the bovine bone, as shown in Fig. 1(a). Due to scattering and absorption, only part of the light passed through the bone specimen and illuminated on the line object adjacent to the bone slab to generate the PA signal. Considering the PA signal of the fine line object was a broadband signal, a needle hydrophone (HNC-1500, Onda) with a broad bandwidth from DC to 20 MHz was used to receive the PA signal. Then, the PA signal was amplified by a pre-amplifier (AH-2010, Onda) and digitized by a digital oscilloscope (TDS 540, Tektronix, Inc., Beaverton, OR, USA). The PA signal was averaged for 50 times to improve the signal to noise ratio (SNR) and then acquired by the PC. By adjusting the laser wavelength, we first studied the wavelength-dependent light transmittance through a bone plate from 680 nm to 950 nm. The max intensity of the PA signal from the line object illuminated by the light transmitted through the bone was recorded at each wavelength. Then, it was normalized by the max intensity of the PA signal from the line object when the 4-mm-thick bone slab was removed. Figure 1(b) shows the normalized PA signal intensity according to the laser wavelength. It could be found that compared with the shorter wavelength, the optical penetration is deeper at a longer wavelength in the spectral range of 680–950 nm. It is mostly because of the light scattering decreasing in the bone with the increasing light wavelength[19].

Figure 1.(a) Experiment setup for studying light penetration in the bovine bone. (b) The light penetration through a 4-mm-thick bone as a function of the laser wavelength. (c) The PA signal of the line object, which was excited by the light transmitted through the bone with different bone thicknesses (6.7 mm to 22 mm). (d) Quantified signal to noise ratio (SNR) as a function of the optical penetration depth. The solid curve shows the exponential fitting following the equation of 92.0 × exp(−0.20 × l).
Then, we studied the PA signals generated by the line object with the laser light transmitting through bone slabs with different bone thicknesses of at the wavelength of 680 nm. As shown in Fig. 1(c), the Y axis showed the relative intensity with respect to the PA signal generated by the line object when the light beam was not blocked by any bone. The SNR was quantified (i.e., the peak-to-peak value of PA signals divided by the peak-to-peak value of noise) for each PA signal. The SNR as a function of the bone thickness (i.e., the light penetration depth in the bone) is shown in Fig. 1(d). The fitting line shown as solid curve presents an exponential fitting with an of 0.99. The optical attenuation coefficient is in the studied bovine femoral head bones, measured by the PA method, as quantified by the solid curve in Fig. 1(d), which is well consistent with the past study based on the human calcaneus bone[20].
In the study of US penetration in the bone, the experimental setup was almost the same as the previous one except that the line object was fixed at the light illumination side and adjacent to the bone slab, as shown in Fig. 2(a). The center frequency of the PA signal generated by the line object was at 1.25 MHz. The PA signal passed through the bone slab and then was detected by the hydrophone. We studied the PA signals penetration in the bone by measuring the PA signal changes with the different bone thicknesses varying from 6.7 mm to 22 mm, as shown in Fig. 2(b). The Y axis showed the relative intensity with respect to the PA signal from the line object when the PA signal detection was not blocked by any bone. The relationship between the quantified SNR and ultrasonic penetration depth is shown in Fig. 2(c), where the exponential fitting line shows the solid line with of 0.99. As quantified by the solid curve in Fig. 2(c), the measured US attenuation coefficient in the studied bovine femoral head samples is 2.6 dB/(MHz·cm)[21,22].
Figure 2.(a) Experiment setup for studying the US penetration in the bone. (b) The PA signals generated by a line object pass through bone samples with different bone thicknesses (6.7 mm to 22 mm). (c) The quantified SNR as a function of US penetration depth with the exponential fitting shown as a solid curve following the equation of 58.2 × exp(−0.33 × l).
Although cortical bone is also affected during osteoporosis, the effects of bone loss are more common in trabecular bones[23]. Therefore, we expect that the depth of PA imaging and measurement can reach the trabecular bone through the cortical layer[24]. In PA imaging and measurement based on the reflection mode, light illumination and US detection are on the same side, and then not only the optical attenuation but the US attenuation in the bone limits the measuring depth. The maximum penetration depth in bone is estimated to be 1.3 cm, calculated from the experiments on bovine bones. This estimate is based on assuming that the dynamic range of the PA system is 1024 (i.e., 10 bits) for the laser wavelength of 680 nm and a PA signal frequency of 1.25 MHz. When working at a higher frequency of 2.25 MHz, the estimated penetration depth is 0.9 cm. Considering that the cortical plate thickness of the human calcaneus is in the range from 0.3 mm (lateral side) to 0.6 mm (medial side), the estimated imaging depths at both 1.25 MHz and 2.25 MHz are sufficient for penetrating the cortical layer and reaching the more important trabecular part of human calcaneus bone[25]. We expect that the PA measurement in the transmission mode will be less affected by the PA signal generated from the bone surface than in the reflection mode. With the transmission mode, the PA signal generated by the deep trabecular bone reaches the transducer earlier than the PA signal generated by the cortical layer at the light illumination side. In this case, the weak trabecular PA signal can be achieved without the interference from the powerful PA signal coming from the cortical layer. When the PA signal of the cortical bone is kept saturated or cannot be detected based on the time gating, the limited dynamic range of the PA system can be completely used for imaging or measuring the target trabecular bone.
To investigate the depth of PA imaging and measurement in transmission mode, fresh bovine femur samples were used that were similar in size to the human calcaneus bone (both cortical and trabecular thickness)[25,26]. The schematic diagram and the geometry of the sample are shown in Fig. 3(a). In the PA measurement, the femoral head was covered with a layer of fresh chicken breast with a thickness of 6 mm, which is similar to the thickness of the soft tissue covering the human calcaneus[27,28]. The PA signal of bone was excited by using the laser with a 2 cm diameter illumination beam at the wavelength of 1064 nm. The light fluence on the soft tissue surface was , which is well below the ANSI safety limit of for human skin at 1064 nm. Due to the high US attenuation in the thick bone tissue (∼32 mm), the experiments were performed by using a low frequency transducer with a center frequency of 2.25 MHz (C323, Panametrics), which benefited for receiving the attenuated signal. An example A-line PA signal from a bovine femoral head is shown in Fig. 3(b) with 100 times average to improve the SNR. The signal of the trabecula can be clearly identified. As shown by the red arrow, we can see strong oscillation (), even at a depth of 26 mm from the surface of the soft tissue illuminated by light. Based on the time of signal propagation and the sound velocity of different types of tissue, a depth of 26 mm can be estimated, including 6 mm soft tissue, 3 mm cortex, and 17 mm trabeculae[27,29–31]. When working in the transmission mode, the light illumination and the US detection are at opposite sides of the bone. With this arrangement, the huge PA signal was generated in the cortical layer at the light illumination side of the bone and arrived later in time of flight. In addition, the cortical layer opposite the laser generated a very low PA signal due to the high light attenuation when penetrating the whole bone. The power spectral density (PSD) of the PA signal from the trabecular achieved by transferring the entire trabeculae PA signal to the frequency domain, as shown in Fig. 3(c). For PA signals obtained from deep trabeculae through the cortical bone and soft tissue, the spectral range defined by 3 dB above the noise level extends above 4 MHz, which means that the SNR is still good for PA signals with frequencies up to 4 MHz.
Figure 3.(a) Schematic diagram for transmission mode PA measurement of a bovine femoral head covered by 5 mm of soft tissue. (b) An example A-line PA signal from the bone. Based on the difference in time-of-flight, the signals from the trabeculae and the cortical and soft tissue can be separated, as marked by the red and the green boxes, respectively. (c) PSD of the PA signal from the trabeculae.
In previous studies, truncation-related photothermal coherence tomography (TC-PCT) technology has been used to bone imaging, demonstrating the ability to distinguish the trabecular structure through the cortical layer in three dimensions[24]. Here, we demonstrated the feasibility of PA imaging in bone. By using the 2D raster scanning with the stepper motor (MD-2 Dual Stepper Motor, Arrick Robotics), the 3D PA image of bone was acquired, as shown in Fig. 4. In order to get the microstructure information of the trabecular bone with higher spatial resolution, we chose a focusing transducer (V312-SU, Panametrics) with a wide bandwidth frequency response. The center frequency of the sensor is ∼10 MHz, the bandwidth of −6 dB is ∼132.63%, the component size is 6.35 mm, and the focal length is 19 mm. The distance between the bone surface and the transducer was 17 mm. The step size of the raster scanning was 0.1 mm along both the x and y axes. The total scanning area was with a total steps. The scanning speed is 0.1 mm/s. It spends about 45 min in scanning for each bone. The sampling rate of the PA signal sampling system is 250 MHz. The bone is illuminated by the light with a beam diameter of 4 cm and light fluence of at the wavelength of 680 nm. The specimens used were beef ribs with the total thickness (both the cortical and trabecular parts) of approximately 1.2 cm. To simulate osteoporosis, the bovine ribs specimens were treated by an EDTA solution with a concentration of 0.5 mol/L for 48 h after the initial scan to demineralize the sample[32]. After treatment, the bovine bones were scanned again. Figure 4(b) shows the example of the PA signal from the bovine bone with and without EDTA treatment.
Figure 4.(a) Schematic diagram of PA imaging of a bovine rib. (b) Example A-line PA signals from the bovine rib with and without the EDTA treatment. The cortical bone (CB) and trabecular bone (TB) could be distinguished based on the time-of-flight. (c) Binarized 3D PA imaging result of the bovine rib without EDTA treatment. (e) Binarized 3D PA imaging result of the bovine rib with EDTA treatment for 48 h. The quantified bone volume densities for the bone with and without EDTA treatment are 32% and 22%, respectively, for (c) and (e). Micro-CT images of the bovine rib (d) without and (f) with EDTA treatment.
With the global image threshold using Otsu’s method, the pixels of the planar image at each depth scale were binarized to better show the microstructure of trabeculae parts in 3D. Figures 4(c) and 4(e) show examples of 3D PA images of a bovine rib with and without the treatment of the EDTA solution. The total thickness of the imaging area is 9 mm, including the cortical and trabecular bone parts. It could be found that the dense features of the cortical bone and the porous features of the trabecular part are well presented in the binary image. Based on the comparison between Figs. 4(c) and 4(e), it can be found that the altering of the bone structure, including the cortical thickness decreasing and the porosity of trabeculae increasing after the EDTA treatment, could be recognized from the PA images. We quantified the bone volume density with the bone volume over the total volume (i.e., BV/TV) for the 3D PA imaging results. The quantified bone volume densities (BV/TV) with and without the EDTA treatment are 32% and 22%, respectively. We also conducted the micro-computed tomography (CT) imaging (eXplore Locus RS, GE Healthcare) on the bone as the gold standard. Comparing with the micro-CT images, as shown in Figs. 4(d) and 4(f), it could be found that the changes in bone microstructures are visualized by the non-ionizing PA imaging. It verified that PA images could present the changes of bone due to the EDTA treatment.
Quantitative analysis of PA signals was acquired at each scan position by using the PASA method[11,16]. Figure 5(a) shows the PSDs of the PA signals in Fig. 4(b). The bone with the EDTA treatment, which results in bone loss, has a stronger high-frequency component, well consistent with our past studies conducted on the rat osteoporosis models[16]. The PSD curve was fitted by linear fitting in the spectrum range determined by −20 dB. The linear fit of the PSD makes it possible to extract the quantized slope of the spectral parameters. As confirmed by previous studies, the slope is related to the mean size of the optical absorbers of trabeculae in bone tissue. Figure 5(b) shows a box plot of the qualified slope of 2500 independent A-line signals. By comparing the results with and without treatment, it could be found that the EDTA-treated bones showed higher slopes. To compare the quantified PASA results of the bovine bone with and without the treatment of EDTA solution, a student -test was conducted with a null hypothesis that there is no difference in the spectral parameter slopes between the PA measurements with and without EDTA treatment. was reached, demonstrating that the quantified PA spectral parameter slope can differentiate the situations of with and without EDTA treatment by detecting the alterations in BMA.
Figure 5.(a) Normalized PSD of PA signals generated from the bone with and without the EDTA treatment, respectively. The fitting line made is shown as the dotted line for each PSD in the spectral range within −20 dB. (b) Quantified PSD parameter slope from the bone with and without the EDTA treatment (). For each box, the median is shown as the central mark, the 25th and 75th percentiles are shown as the edges of the box, and the outliers are plotted separately.
This study explored the potential of PA technology based on light and US penetration in bone and the 3D PA imaging of bone. It is based on bovine bone samples with the bone size similar to human bones. According to experiments, both optical and ultrasonic penetrating bones at low frequency are enough for non-invasive PA measurements of human bones (such as the calcaneus). Besides, the 3D PA imaging using a raster scan with a focused transducer has been conducted on the bovine bones with different BMDs. The preliminary results show that the 3D binarized PA images can reflect the microstructure characteristics of cortical bone and trabecular bone and can distinguish the changes of bone microstructure resulting from treatment with the EDTA solution. By using PASA, the alteration of the bone microstructure can be quantified by analysis. By comparing with the measurement of mass BMD, PA techniques can provide information of both BMA and chemical properties. Therefore, it can provide more valuable bone health information and better predict the reduction of fractures. Our studies indicate that the PA technology can obtain the information of physical and chemical biomarkers, which have a high correlation with osteoporosis and other bone diseases in a non-ionizing and non-invasive manner. In future work, the PA signal should be calibrated by the frequency response of the transducer before PASA. In addition, the effect of US attenuation on the PSD curves should be taken into account. Furthermore, PACT will be considered for bone imaging. PACT is based on the reconstruction of the PA signal acquired from different directions, which could provide more details of the bone structure and get better imaging quality.
References
[1] N. Harvey, E. Dennison, C. Cooper. Nat. Rev. Rheumatol., 6, 99(2010).
[2] J. F. Griffith, D. K. Yeung, G. E. Antonio, F. K. Lee, A. W. Hong, S. Y. Wong, E. M. Lau, P. C. Leung. Radiol., 236, 945(2005).
[3] J. Töyräs, M. Nieminen, H. Kröger, J. Jurvelin. Bone, 31, 503(2002).
[4] C. Liu, D. Ta, F. Fujita, T. Hachiken, M. Matsukawa, K. Mizuno, W. Wang. J. Appl. Phys., 115, 064906(2014).
[5] C. Njeh, C. Boivin, C. Langton. Osteoporosis Int., 7, 7(1997).
[6] K. A. Wear. IEEE Trans. Ultrason. Ferroelectrics Frequency Control, 67, 454(2020).
[7] X. Wang, Y. Pang, G. Ku, X. Xie, G. Stoica, L. V. Wang. Nat. Biotechnol., 21, 803(2003).
[8] P. K. Upputuri, M. Pramanik. J. Biomed. Opt., 22, 041006(2016).
[9] L. V. Wang, S. Hu. Science, 335, 1458(2012).
[10] Y. Zhu, X. Lu, X. Dong, J. Yuan, M. L. Fabiilli, X. Wang. Tissue Eng. Part C: Methods, 25, 523(2019).
[11] G. Xu, Z.-X. Meng, J. D. Lin, J. Yuan, P. L. Carson, B. Joshi, X. Wang. Radiology, 271, 248(2014).
[12] C. Tian, M. Pei, K. Shen, S. Liu, Z. Hu, T. Feng. Phys. Rev. Appl., 13, 014001(2020).
[13] B. Lashkari, L. Yang, A. Mandelis. Quant. Imag. Med. Surg., 5, 46(2015).
[14] L. Yang, B. Lashkari, A. Mandelis, J. W. Tan. Int. J. Thermophys., 36, 25217(2015).
[15] T. Feng, K. M. Kozloff, C. Tian, J. E. Perosky, Y. S. Hsiao, S. Du, J. Yuan, C. X. Deng, X. Wang. Opt. Lett., 40, 1721(2015).
[16] T. Feng, J. E. Perosky, K. M. Kozloff, G. Xu, Q. Cheng, S. Du, J. Yuan, C. X. Deng, X. Wang. Opt. Express, 23, 25217(2015).
[17] X. Zhou, Z. Jin, T. Feng, Q. Cheng, X. Wang, Y. Ding, H. Zhan, J. Yuan. Chin. Opt. Lett., 18, 041701(2020).
[18] I. Steinberg, L. Shiloh, I. Gannot, A. Eyal. IEEE J. Sel. Top. Quantum Electron, 25, 7201908(2018).
[19] S. L. Jacques. Phys. Med. Biol., 58, R37(2013).
[20] A. Pifferi, A. Torricelli, P. Taroni, A.L. Bassi, E. Chikoidze, E. Giambattistelli, R. Cubeddu. J. Biomed. Opt., 9, 474(2004).
[21] S. Chaffaı, F. Padilla, G. Berger, P. Laugier. J. Acoust. Soc. Am., 108, 1281(2000).
[22] M. O. Culjat, D. Goldenberg, P. Tewari, R. S. Singh. Ultrasound Med. Biol., 36, 861(2010).
[23] E. Mittra, C. Rubin, B. Gruber, Y. X. Qin. J. Biomech., 41, 368(2008).
[24] S. Kaiplavil, A. Mandelis, X. Wang, T. Feng. Biomed. Opt. Express, 5, 2488(2014).
[25] Y. Xia, W. Lin, Y. X. Qin. J. Acoust. Soc. Am., 118, 1801(2005).
[26] P. H. Nicholson, G. Lowet, X. G. Cheng, S. Boonen, G. van der Perre, J. Dequeker. Bone, 20, 219(1997).
[27] C. Chappard, E. Camus, F. Lefebvre, G. Guillot, J. Bittoun, G. Berger, P. Laugier. J. Clin. Densitom., 3, 121(2000).
[28] A. Pejovic-Milic, J. A. Brito, J. Gyorffy, D. R. Chettle. Med. Phys., 29, 2687(2002).
[29] P. Laugier, P. Droin, A. M. Laval-Jeantet, G. Berger. Bone, 20, 157(1997).
[30] S. Guipieri, Y. Nagatani, R. Bosc, V. H. Nguyen, C. Chappard, D. Geiger, G. Haiat. Ultrasound Med. Biol., 41, 2966(2015).
[31] H. Sievanen, S. Cheng, S. Ollikainen, K. Uusi-Rasi. Osteoporosis Int., 12, 399(2001).
[32] H. Ehrlich, P. G. Koutsoukos, K. D. Demadis, O. S. Pokrovsky. Micron, 40, 169(2009).