• Spectroscopy and Spectral Analysis
  • Vol. 42, Issue 3, 795 (2022)
Jie WU1、1;, Chuang-kai LI1、1;, Wen-jun CHEN1、1;, Yan-xin HUANG1、1;, Nan ZHAO1、1;, Jia-ming LI1、1; 2; *;, Huan YANG3、3;, Xiang-you LI4、4;, Qi-tao LÜ3、3; 5;, and Qing-mao ZHANG1、1; 2; 5;
Author Affiliations
  • 11. Guangdong Provinical Key Laboratory of Nanophotonic Functional Materials and Devices, School of Information and Optoelectronic Science and Engineering, South China Normal University, Guangzhou 510006, China
  • 33. Sino-German College of Intelligent Manufacturing, Shenzhen Technology University, Shenzhen 518118, China
  • 44. Wuhan National Laboratory for Optoelectronics (WNLO), Huazhong University of Science and Technology, Wuhan 430074, China
  • show less
    DOI: 10.3964/j.issn.1000-0593(2022)03-0795-07 Cite this Article
    Jie WU, Chuang-kai LI, Wen-jun CHEN, Yan-xin HUANG, Nan ZHAO, Jia-ming LI, Huan YANG, Xiang-you LI, Qi-tao LÜ, Qing-mao ZHANG. Multiple Liner Regression for Improving the Accuracy of Laser-Induced Breakdown Spectroscopy Assisted With Laser-Induced Fluorescence (LIBS-LIF)[J]. Spectroscopy and Spectral Analysis, 2022, 42(3): 795 Copy Citation Text show less
    Schematic diagram of LIBS-LIF experimental setup
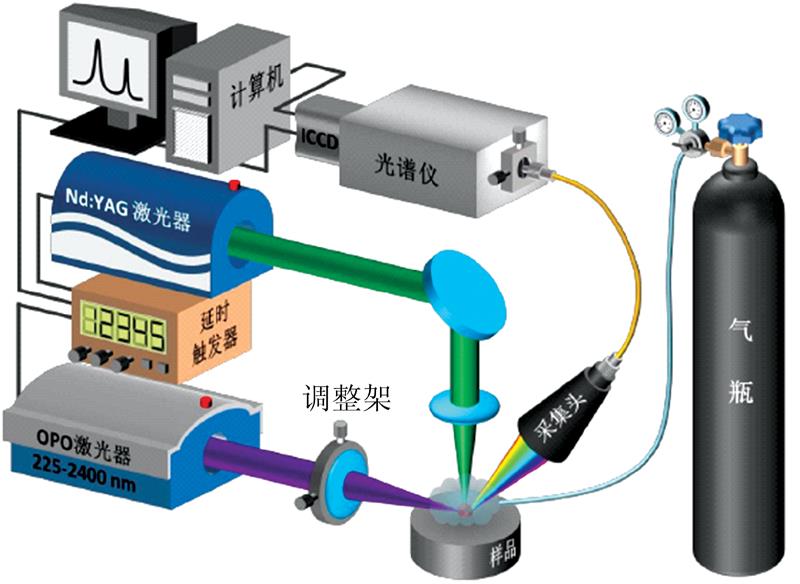
    Fig. 1. Schematic diagram of LIBS-LIF experimental setup
    Results of Cr concentrations (a) and Ni concentrations (b) predicted by simple linear regression
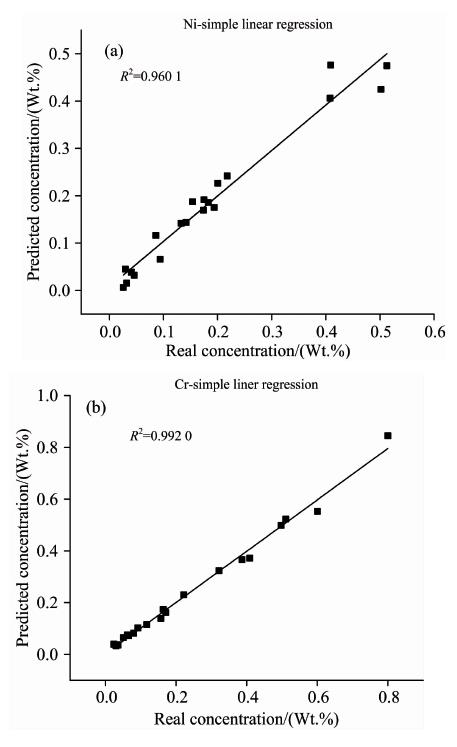
    Fig. 2. Results of Cr concentrations (a) and Ni concentrations (b) predicted by simple linear regression
    LIBS spectral intensities of Ni containing samples (a) and Cr containing samples (b)
    Fig. 3. LIBS spectral intensities of Ni containing samples (a) and Cr containing samples (b)
    Results of Ni concentrations (a) and Cr concentrations (b) predicted by multiple linear regression
    Fig. 4. Results of Ni concentrations (a) and Cr concentrations (b) predicted by multiple linear regression
    The fitting coefficients of Ni(a) and Cr(b) with different dimensions
    Fig. 5. The fitting coefficients of Ni(a) and Cr(b) with different dimensions
    ARE of Ni(a) and Cr(b) with different dimensions
    Fig. 6. ARE of Ni(a) and Cr(b) with different dimensions
    RESECV of Ni (a) and Cr (b) with different dimensions
    Fig. 7. RESECV of Ni (a) and Cr (b) with different dimensions
    No.No.
    10.4090.164120.200 60.051
    20.0860.322130.1540.024
    30.2180.092140.0210.001 5
    40.4080.409150.0020.8
    50.1330.601160.1830.511
    60.030.062170.1940.08
    70.1750.036180.0460.03
    80.1420.066190.0320.117
    90.0410.007 2200.5020.171
    100.1740.222210.0940.387
    110.5130.498220.0260.157
    Table 1. Concentrations of Cr and Ni in micro alloyed steel samples(Wt%)
    NiCr
    波长Ni拟合
    系数×10-6
    对应
    元素
    波长Cr拟合
    系数×10-6
    对应
    元素
    301.2631.14Ni428.997.48Cr
    305.1519.98Ni425.076.49Fe
    305.8318.42Ni427.506.34Cr
    310.2514.27Ni432.636.00Fe
    303.8510.35Ni425.464.83Cr
    305.507.88Ni430.813.38Fe
    300.345.40Ni420.212.91Fe
    306.742.55Fe428.372.62Fe
    427.171.52Fe
    426.061.47Fe
    Table 2. Regression coefficients of multiple linear regression
    Jie WU, Chuang-kai LI, Wen-jun CHEN, Yan-xin HUANG, Nan ZHAO, Jia-ming LI, Huan YANG, Xiang-you LI, Qi-tao LÜ, Qing-mao ZHANG. Multiple Liner Regression for Improving the Accuracy of Laser-Induced Breakdown Spectroscopy Assisted With Laser-Induced Fluorescence (LIBS-LIF)[J]. Spectroscopy and Spectral Analysis, 2022, 42(3): 795
    Download Citation