- Spectroscopy and Spectral Analysis
- Vol. 42, Issue 4, 1028 (2022)
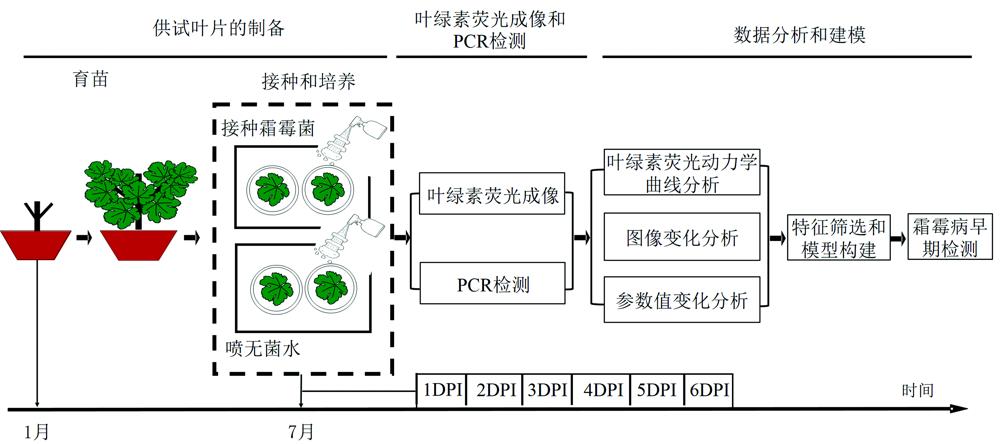
Fig. 1. Flow chart of the experiment
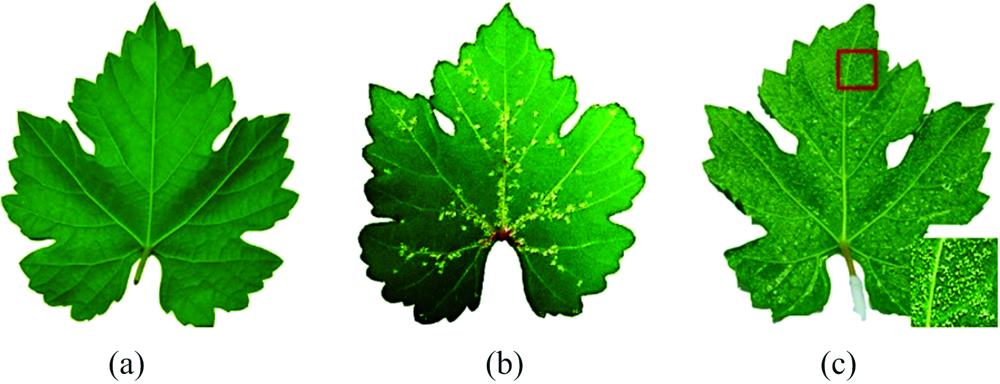
Fig. 2. Healthy leaves and inoculated leaves with disease spots at 6 DPI
(a): Heathy leaf; (b): Leaf with scattered lesions; (c): Leaf covered with lesions
(a): Heathy leaf; (b): Leaf with scattered lesions; (c): Leaf covered with lesions
Fig. 3. Chlorophyll fluorescence imaging system
Fig. 4. Chlorophyll fluorescence measurement procedure
Fig. 5. Flow chart of feature selection algorithm (SFFS) and model construction
Fig. 6. PCR values of healthy and inoculated samples measured 6 consecutive days after inoculation
Fig. 7. Representative kinetic chlorophyll fluorescence curves of healthy and inoculated leaves
(a): 1 DPI; (b): 2 DPI; (c): 6 DPI
(a): 1 DPI; (b): 2 DPI; (c): 6 DPI
Fig. 8. RGB and chlorophyll fluorescence parameter images of leaves inoculated with Plasmopara viticola
Fig. 9. Means and standard deviations of chlorophyll fluorescence parameters of grape leaves healthy and inoculated with downy mildew for 6 consecutive days (statistically significant differences are indicated)
*p <0.05; **p <0.01; ***p <0.001
*
|
Table 1. Real time fluorescent quantitative PCR primers
|
Table 2. Fluorescence parameters commonly used in detection of plant stress
|
Table 3. Classification results of healthy and inoculated leaf by LR, SVM and RF using SFFS and Relief optimal features
| ||||||||||||||||||||||||||||||||||||||||||||||||||||
Table 4. Reorganization results of healthy (CK) and diseased leaves at different DPI based on SFFS-BP

Download Citation

Set citation alerts for the article
Please enter your email address
© Copyright 2018-2021 | Chinese Laser Press. All Rights Reserved 沪ICP备15018463号-20