• Advanced Photonics Nexus
  • Vol. 2, Issue 4, 044002 (2023)
Xitian Hu, Li Zhou, Xu Wu, and Yan Peng*
Author Affiliations
  • University of Shanghai for Science and Technology, Terahertz Technology Innovation Research Institute, Terahertz Spectrum and Imaging Technology Cooperative Innovation Center, Shanghai Key Lab of Modern Optical System, Shanghai, China
  • show less
    DOI: 10.1117/1.APN.2.4.044002 Cite this Article Set citation alerts
    Xitian Hu, Li Zhou, Xu Wu, Yan Peng. Review on near-field detection technology in the biomedical field[J]. Advanced Photonics Nexus, 2023, 2(4): 044002 Copy Citation Text show less
    The framework of this review. This review focuses on the recent biomedical research progress of several near-field techniques (including s-SNOM, AFM-IR, PFIR, and PiFM) from the perspective of different environments (including nonliquid environments and liquid environments) and different biological samples. The possibility of in vivo detection is also discussed. Adapted with permission from Refs. 5–8" target="_self" style="display: inline;">–8. Adapted with permission from Ref. 9. © 2018 American Chemical Society. All article content, except where otherwise noted, is licensed under a Creative Commons Attribution (CC BY) license.
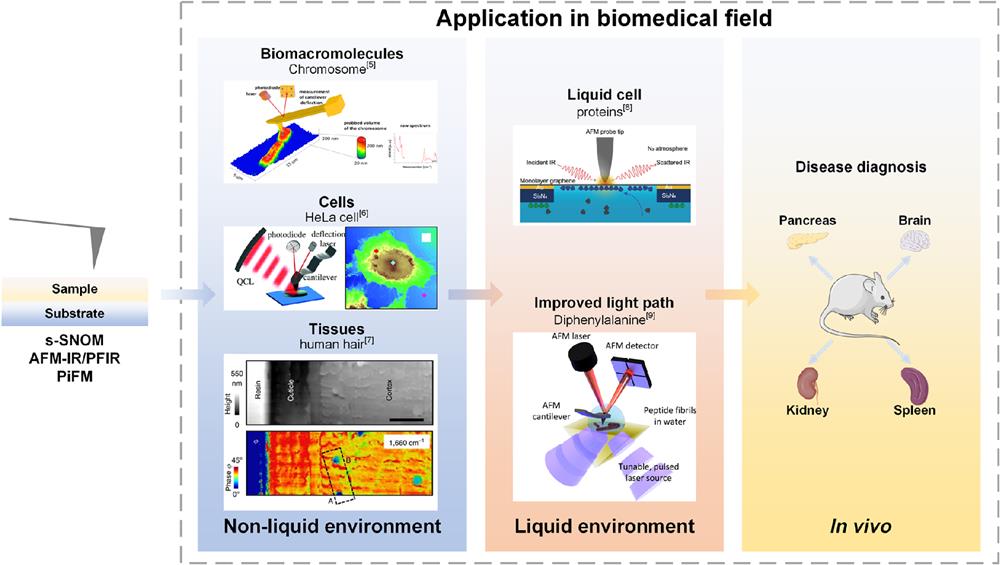
    Fig. 1. The framework of this review. This review focuses on the recent biomedical research progress of several near-field techniques (including s-SNOM, AFM-IR, PFIR, and PiFM) from the perspective of different environments (including nonliquid environments and liquid environments) and different biological samples. The possibility of in vivo detection is also discussed. Adapted with permission from Refs. 58" target="_self" style="display: inline;">8. Adapted with permission from Ref. 9. © 2018 American Chemical Society. All article content, except where otherwise noted, is licensed under a Creative Commons Attribution (CC BY) license.
    The application of near-field detection of biological macromolecular samples. (a) The average IR spectra and the second derivative spectra obtained from three kinds of FUS. Adapted with permission from Ref. 17. (b) PiFM images of particles composed of proteins at different frequencies. Adapted with permission from Ref. 18 © 2019 American Chemical Society. (c) Spectra comparison between AFM-IR and FTIR with two proteins. Adapted with permission from Ref. 19. (d) AFM-IR ratio map between two integrated absorption bands and the results of immuno-staining. Adapted with permission from Ref. 5. (e) s-SNOM results of influenza virus. Adapted with permission from Ref. 20.
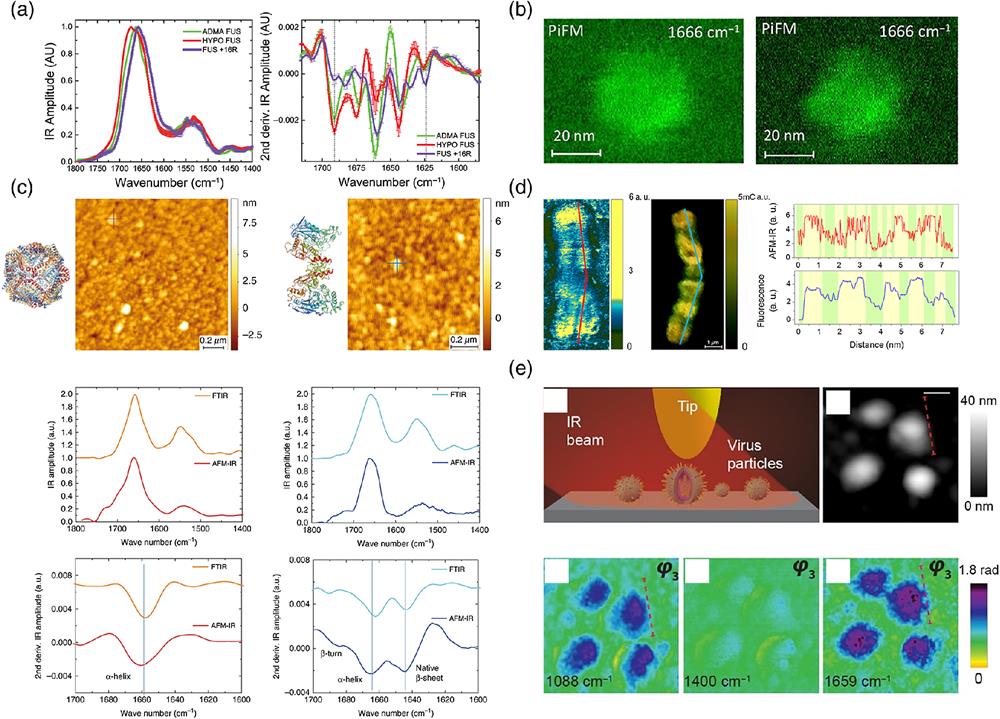
    Fig. 2. The application of near-field detection of biological macromolecular samples. (a) The average IR spectra and the second derivative spectra obtained from three kinds of FUS. Adapted with permission from Ref. 17. (b) PiFM images of particles composed of proteins at different frequencies. Adapted with permission from Ref. 18 © 2019 American Chemical Society. (c) Spectra comparison between AFM-IR and FTIR with two proteins. Adapted with permission from Ref. 19. (d) AFM-IR ratio map between two integrated absorption bands and the results of immuno-staining. Adapted with permission from Ref. 5. (e) s-SNOM results of influenza virus. Adapted with permission from Ref. 20.
    The application of near-field detection of cell samples. (a) AFM-IR maps of single primary neurons. Adapted with permission from Ref. 58. (b) s-SNOM results of the genetically modified E. coli. (c) The phase spectra obtained on two spots in (b). (b), (c) Adapted with permission from Ref. 59. (d) The phase images of Chlamydomonas reinhardtii cell obtained by the s-SNOM. (e) The reconstruction of cellular spectroscopic tomography from (d). (d), (e) Adapted with permission from Ref. 60. (f) PFIR images of zymosan particles. Adapted with permission from Ref. 61 © 2020 American Chemical Society.
    Fig. 3. The application of near-field detection of cell samples. (a) AFM-IR maps of single primary neurons. Adapted with permission from Ref. 58. (b) s-SNOM results of the genetically modified E. coli. (c) The phase spectra obtained on two spots in (b). (b), (c) Adapted with permission from Ref. 59. (d) The phase images of Chlamydomonas reinhardtii cell obtained by the s-SNOM. (e) The reconstruction of cellular spectroscopic tomography from (d). (d), (e) Adapted with permission from Ref. 60. (f) PFIR images of zymosan particles. Adapted with permission from Ref. 61 © 2020 American Chemical Society.
    The application of near-field detection of bio-tissues. (a), (b) The phase images and spectra of organic sheath. Adapted with permission from Ref. 78. (c) Near-field results of three feature locations in a human hair cross section. Adapted with permission from Ref. 7. (d) Infrared s-SNOM measurements of pheomelanin and eumelanin in sheep black hair. Adapted with permission from Ref. 79. (e) Nanospectra obtained from seven positions for awns of wheat. Adapted with permission from Ref. 80 © 2020 American Chemical Society.
    Fig. 4. The application of near-field detection of bio-tissues. (a), (b) The phase images and spectra of organic sheath. Adapted with permission from Ref. 78. (c) Near-field results of three feature locations in a human hair cross section. Adapted with permission from Ref. 7. (d) Infrared s-SNOM measurements of pheomelanin and eumelanin in sheep black hair. Adapted with permission from Ref. 79. (e) Nanospectra obtained from seven positions for awns of wheat. Adapted with permission from Ref. 80 © 2020 American Chemical Society.
    The application of near-field detection in liquid environment. (a), (b) AFM-IR results of the FF and Boc-FF in D2O. Adapted with permission from Ref. 9 © 2018 American Chemical Society. (c), (d) The changes of nanospectra of S-layer proteins with time. Adapted with permission from Ref. 8. (e)–(g) Near-field third harmonic amplitude (e) and phase (f) and AFM topography (g) of purple membranes in water. Adapted with permission from Ref. 97 © 2020 American Chemical Society. (h)–(j) Li-PFIR microscopy results of yeast cell. Adapted with permission from Ref. 98 © 2021 American Chemical Society.
    Fig. 5. The application of near-field detection in liquid environment. (a), (b) AFM-IR results of the FF and Boc-FF in D2O. Adapted with permission from Ref. 9 © 2018 American Chemical Society. (c), (d) The changes of nanospectra of S-layer proteins with time. Adapted with permission from Ref. 8. (e)–(g) Near-field third harmonic amplitude (e) and phase (f) and AFM topography (g) of purple membranes in water. Adapted with permission from Ref. 97 © 2020 American Chemical Society. (h)–(j) Li-PFIR microscopy results of yeast cell. Adapted with permission from Ref. 98 © 2021 American Chemical Society.
    Xitian Hu, Li Zhou, Xu Wu, Yan Peng. Review on near-field detection technology in the biomedical field[J]. Advanced Photonics Nexus, 2023, 2(4): 044002
    Download Citation