• Journal of Resources and Ecology
  • Vol. 11, Issue 6, 606 (2020)
Mengyu ZHANG1、2、3, Li ZHANG1、2、4、*, Xiaoli REN1、2, Honglin HE1、2、4, Yan LV1、2、3, Junbang WANG1, and Huimin YAN5
Author Affiliations
  • 1Key Laboratory of Ecosystem Network Observation and Modeling, Institute of Geographic Sciences and Natural Resources Research, Chinese Academy of Sciences, Beijing 100101, China
  • 2National Ecosystem Science Data Center, Beijing 100101, China
  • 3University of Chinese Academy of Sciences, Beijing 100049, China
  • 4College of Resources and Environment, University of Chinese Academy of Sciences, Beijing 100190, China
  • 5Key Laboratory of Resource Utilization and Environmental Remediation, Institute of Geographic Sciences and Natural Resources Research, Chinese Academy of Sciences, Beijing 100101, China
  • show less
    DOI: 10.5814/j.issn.1674-764x.2020.06.008 Cite this Article
    Mengyu ZHANG, Li ZHANG, Xiaoli REN, Honglin HE, Yan LV, Junbang WANG, Huimin YAN. Effect of Land Use and Land Cover Change on the Changes in Net Primary Productivity in Karst Areas of Southwest China: A Case Study of Huanjiang Maonan Autonomous County[J]. Journal of Resources and Ecology, 2020, 11(6): 606 Copy Citation Text show less
    Location of the study area Note: Numbers 1 to 6 represent Dongmei, Caixia, Guzhou, Sancai, Hanwen, and Renhe small watersheds, respectively. The rocky desertification control project (referred to as RDCP) and the status of rocky desertification in all of the small watersheds were organized according to the “Huanjiang County Rock Desertification Comprehensive Management and Construction Project” and related implementation plans during 2008-2010. Due to the lag of the effect of project implementation, the RDCP activity during 2011-2013 was not considered in this study.
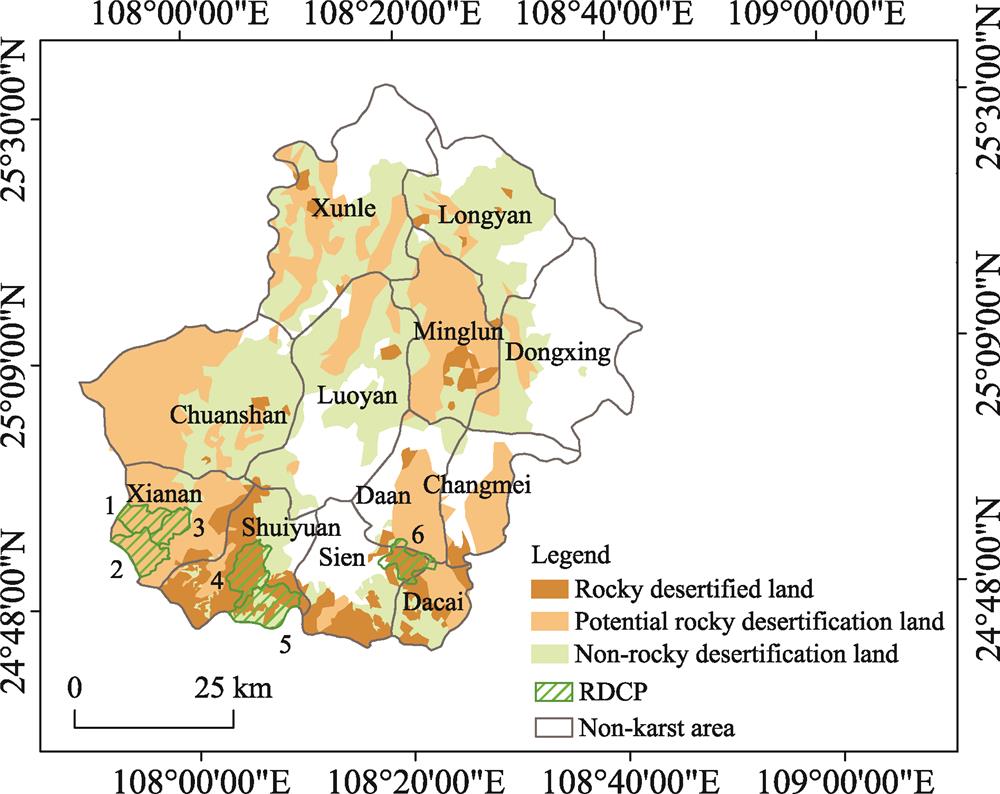
    Fig. 1. Location of the study area Note: Numbers 1 to 6 represent Dongmei, Caixia, Guzhou, Sancai, Hanwen, and Renhe small watersheds, respectively. The rocky desertification control project (referred to as RDCP) and the status of rocky desertification in all of the small watersheds were organized according to the “Huanjiang County Rock Desertification Comprehensive Management and Construction Project” and related implementation plans during 2008-2010. Due to the lag of the effect of project implementation, the RDCP activity during 2011-2013 was not considered in this study.
    Land use classification and mapping in Huanjiang County in (a) 2008 and (b) 2013
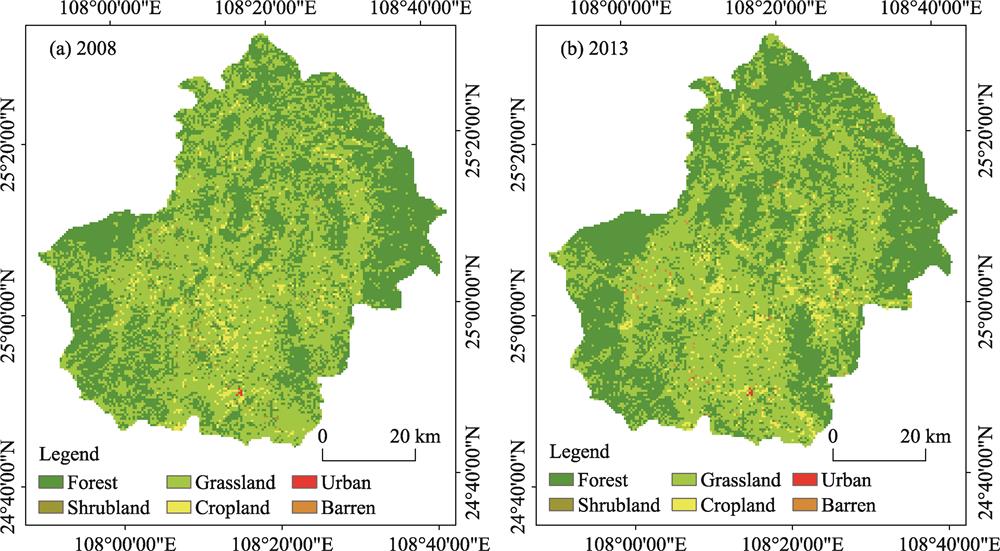
    Fig. 2. Land use classification and mapping in Huanjiang County in (a) 2008 and (b) 2013
    NPP changes in Huanjiang County during 2008-2013. (a) Distribution of NPP values in the county, (b) Distribution of NPP values in non-rocky desertification area (NRDL) and the potential rocky desertification or rocky desertification land (P/RDL); (c) Distribution and (d) spatial pattern of the NPP change index (K). Red dots are the averages.
    Fig. 3. NPP changes in Huanjiang County during 2008-2013. (a) Distribution of NPP values in the county, (b) Distribution of NPP values in non-rocky desertification area (NRDL) and the potential rocky desertification or rocky desertification land (P/RDL); (c) Distribution and (d) spatial pattern of the NPP change index (K). Red dots are the averages.
    Spatial patterns of effects of (a) LUCC, (b) ECF and (c) their interaction on NPP, and (d) statistics for the total effect of factors on the |K|≥0.21 (i.e. the third quantile of the NPP change index) area.
    Fig. 4. Spatial patterns of effects of (a) LUCC, (b) ECF and (c) their interaction on NPP, and (d) statistics for the total effect of factors on the |K|≥0.21 (i.e. the third quantile of the NPP change index) area.
    Spatial distribution of (a) RDCP (see Fig. 1) and (b-g) vegetation restoration measures (referred to as VRM; i.e. closing hills for afforestation, artificial afforestation, and artificial grass) in each of the six small watersheds
    Fig. 5. Spatial distribution of (a) RDCP (see Fig. 1) and (b-g) vegetation restoration measures (referred to as VRM; i.e. closing hills for afforestation, artificial afforestation, and artificial grass) in each of the six small watersheds
    The relative contributions of LUCC, ECF change and their interaction on NPP changes in the region with obviously changed NPP, i.e. the third quantile of the NPP change index (|K|≥0.21 during 2008-2013; |K|≥0.23 during 2005-2011).
    Fig. 6. The relative contributions of LUCC, ECF change and their interaction on NPP changes in the region with obviously changed NPP, i.e. the third quantile of the NPP change index (|K|≥0.21 during 2008-2013; |K|≥0.23 during 2005-2011).
    Reclassified typeMODIS land cover type 2 (UMD)
    WaterWater bodies
    ForestsEvergreen needleleaf forest, Evergreen broadleaf forest, Deciduous needleleaf forest, Deciduous broadleaf forest, Mixed forest
    ShrublandsClosed shrublands, Open shrublands
    GrasslandsWoody savannas, Savannas, Grasslands
    CroplandsCroplands
    UrbanUrban and built-up lands
    BarrenBarren or sparsely vegetated lands
    Table 1.

    Landuse types in the reclassification

    RegionK_LUCCK_ECFK_interactionK mean
    EffectContribution (%)EffectContribution (%)EffectContribution (%)
    -0.36≤K<0.090.01336.470.02161.600.0011.920.034
    0.09≤K<0.150.03730.280.08065.900.0053.820.121
    0.15≤K<0.210.04927.190.12167.680.0095.140.178
    |K|≥0.210.05319.890.19773.920.0176.180.267
    Areas where LUCC occurs0.10570.970.02114.510.02114.510.148
    Huanjiang County0.03925.230.10669.610.0085.160.153
    Table 2.

    Statistics of K that are attributed to land use and land cover change (referred to as LUCC), the environmental comprehensive factor (ECF), and their interaction.

    2008-2013ForestsShrublandsGrasslandsCroplands2008
    Forests0.21585.1615.46600.83
    Shrublands6.0139.501.9347.44
    Grasslands748.301.29130.08879.67
    Croplands18.030.00104.75122.78
    2013772.341.50729.41147.47
    Table 3.

    Land use transfer matrix (2008-2013) (unit: km2)

    RegionsKWatershedsK of VRMAreas (km2)
    VRMNon-RDCP
    Region 10.174*0.161*Guzhou0.15118.43
    Dongmei0.13113.16
    Caixia0.20829.26
    Region 20.128**0.106**Sancai0.10827.41
    Hanwen0.16226.08
    Region 30.137**0.078**Renhe0.13715.73
    Table 4.

    Comparison of the NPP dynamic index (K) values between regions with the implementation of vegetation restoration measures and 1 km buffer areas outside of those governance regions in the six small watersheds

    Mengyu ZHANG, Li ZHANG, Xiaoli REN, Honglin HE, Yan LV, Junbang WANG, Huimin YAN. Effect of Land Use and Land Cover Change on the Changes in Net Primary Productivity in Karst Areas of Southwest China: A Case Study of Huanjiang Maonan Autonomous County[J]. Journal of Resources and Ecology, 2020, 11(6): 606
    Download Citation