1Key Laboratory of Ecosystem Network Observation and Modeling, Institute of Geographic Sciences and Natural Resources Research, Chinese Academy of Sciences, Beijing 100101, China
2National Ecosystem Science Data Center, Beijing 100101, China
3University of Chinese Academy of Sciences, Beijing 100049, China
4College of Resources and Environment, University of Chinese Academy of Sciences, Beijing 100190, China
5Key Laboratory of Resource Utilization and Environmental Remediation, Institute of Geographic Sciences and Natural Resources Research, Chinese Academy of Sciences, Beijing 100101, China
Mengyu ZHANG, Li ZHANG, Xiaoli REN, Honglin HE, Yan LV, Junbang WANG, Huimin YAN. Effect of Land Use and Land Cover Change on the Changes in Net Primary Productivity in Karst Areas of Southwest China: A Case Study of Huanjiang Maonan Autonomous County[J]. Journal of Resources and Ecology, 2020, 11(6): 606
Copy Citation Text
Karst areas in southwest China have experienced significant land cover and land use change (LUCC) due to utilization for human activity and a comprehensive rocky desertification control project (RDCP) since 2008. It is important to quantify the effect of LUCC on ecosystem productivity in this region for assessing the overall benefit of this ecological restoration project. In this study, we used using MODIS land cover and NPP products to investigate the relative contribution of LUCC to the change in net primary productivity (NPP) during 2008-2013 in Huanjiang County, one of first one hundred pilot counties to implement RDCP. Our results show that NPP increased in 95.53% of the county, and the average growth of NPP in non-rocky desertification area was higher than in rocky desertification or potential rocky desertification areas. LUCC has an important contribution (25.23%) to the NPP increase in the county, especially in the LUCC area (70.97%), which increased the average NPP by 3.9% and 10.5%, respectively. Across the six RDCP regions in the county, the average increase in NPP for the vegetation restoration measure of governed karst area is significantly greater than in the ungoverned karst area, and the positive change in NPP increased with the increasing implementation area of the vegetation restoration measure.
The karst area in southwestern China is one of the three major karst areas in the world with noticeable problems of poverty and environmental degradation. On the one hand, land use and land cover change (referred to as LUCC) activities caused by the expansion of buildings and the cultivation of steep slopes have strengthened rocky desertification (Zhao and Hou, 2019). On the other hand, ecological projects in the karst area, such as the Grain for Green Program since 2002 and the rocky desertification control project (referred to as RDCP) since 2008, led to the conversion of cultivated land to forests and grasslands (Song et al., 2014; Chen et al., 2018; Liao et al., 2018; Tong et al., 2018), and caused a significant increase in NDVI, leaf area index, aboveground biomass, and soil carbon storage, particularly in the counties with strong conservation efforts (Cai et al., 2014; Fang et al., 2014; Song et al., 2014; Li et al., 2016; Hu et al., 2017; Tong et al., 2018). Quantitatively evaluating the effects of LUCC in China's karst regions since the implementation of RDCP has been an urgent problem in the context of global change, and it is a prerequisite for the rational and effective use of land resources, combating climate change risks, maintaining ecosystem stability, and enhancing ecological functions in the region.
Net Primary Productivity (NPP) is the material basis for plant growth, development and reproduction, and a key indicator for studying the responses of the carbon cycle and ecosystem functions to climate change and LUCC. Researchers have made efforts to quantify the impact of human activities (such as harvest and LUCC) on NPP. For example, Haberl et al. (2001) calculated the human appropriation of NPP (HANPP) in Austria using the differences between potential NPP without human interference and actual NPP driven by an LUCC model and harvest data, and found that NPP affected by human activities accounted for half of the total NPP. Desouza and Malhi (2017) calculated the total HANPP of the harvest and LUCC in India, and found that the proportion of human-occupied NPP has increased from 29% to 73% over the past 300 years. Chen et al. (2014) calculated the HANPP of the Qinghai-Tibet Plateau using the NPP simulated by the climate model and the CASA model, and found that the proportion of HANPP in the decade after 2000 (42.98%) was twice that of the previous two decades (20.16%). Different LUCCs (such as urban expansion or returning farmland to forest) have different effects. Urban expansion dominates the NPP reduction by more than 15%, with an obvious decrease (Fu et al., 2013). In contrast, the six major ecological restoration projects with positive LUCC which have been implemented in China fixed 74 Tg C annually during 2000-2010, accounting for 56% of the total carbon sequestration in that period (Lu et al., 2018). However, it is still unclear how LUCC affects NPP changes in the karst region of southwest China under the implementation of the RDCP project.
Previous studies have shown that the increases in NDVI and carbon sequestration in the northwestern part of Guangxi Zhuang Autonomous Region are higher than in other karst regions (Zhang et al., 2015; Tong et al., 2017). Huanjiang Maonan Autonomous County (referred to as Huanjing County) in northwestern Guangxi Zhuang Autonomous Region is one of the first 100 counties to implement the rocky desertification control project. In this study, we selected Huanjiang County as a case study for evaluating the effect of LUCC on NPP changes. Here, the MODIS land use and NPP data were used to analyze the spatial and temporal variation in NPP during 2008-2013 and the relative contribution of LUCC to NPP changes. We also analyzed the sensitivity of the LUCC effect to the land cover data. The NPP changes in the six RDCP regions of Huanjiang County (i.e. Renhe, Sancai, Hanwen, Guzhou, Caixia, and Dongmei) were compared to the adjacent ungoverned karst area to investigate the effect of RDCP.
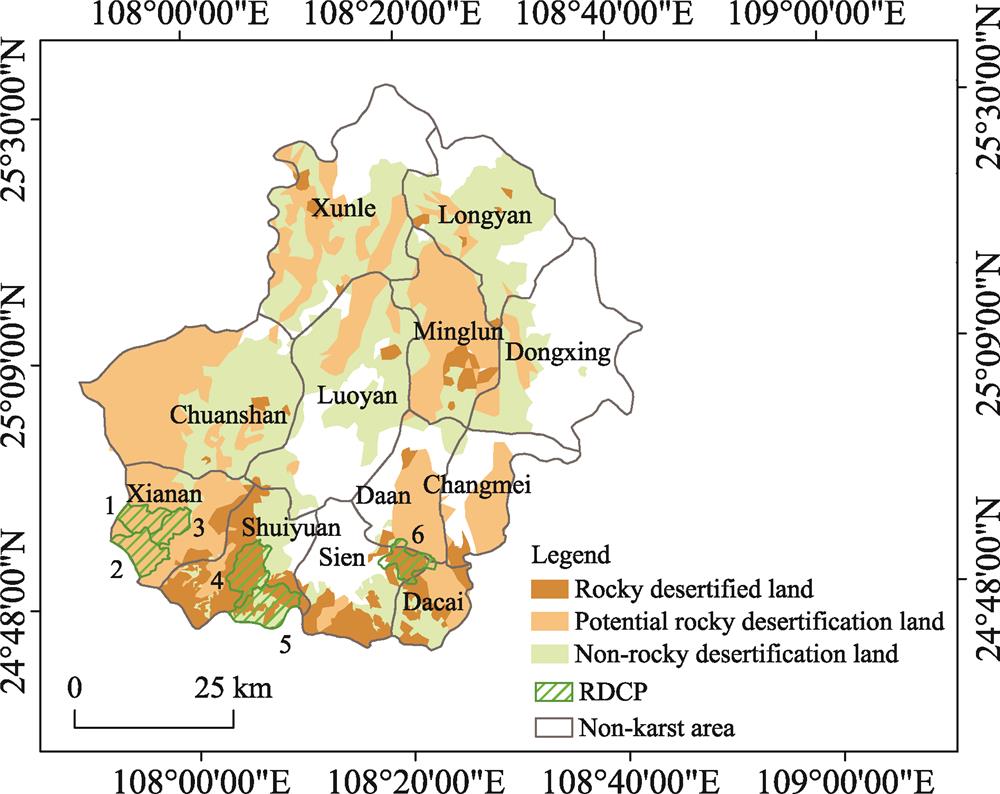
Figure 1.
Location of the study area Note: Numbers 1 to 6 represent Dongmei, Caixia, Guzhou, Sancai, Hanwen, and Renhe small watersheds, respectively. The rocky desertification control project (referred to as RDCP) and the status of rocky desertification in all of the small watersheds were organized according to the “Huanjiang County Rock Desertification Comprehensive Management and Construction Project” and related implementation plans during 2008-2010. Due to the lag of the effect of project implementation, the RDCP activity during 2011-2013 was not considered in this study.
Huanjiang County (107o51°E-108o43°E, 24o44°N-25o33°N) is located in the southwestern karst region of China (Fig. 1), which belongs to the subtropical monsoon climate zone, and has mild weather, abundant rainfall and sufficient sunshine. The annual average temperature ranged from 18.3 ℃ to 19.4 ℃, and annual precipitation ranged from 1157.3 mm to 1750.5 mm during 2000-2015, with most rain falling between April and September. The main land covers are forest, grassland and farmland, accounting for 47.57%, 48.08% and 3.90% in 2013, respectively (Fig. 2).
The area of karst land in Huanjiang county is 328697.7 ha, occupying 72.2% of the whole county land area. The proportions of rocky desertification, potential rocky desertification and non-rocky desertification land are 1:3.44:3.74 (Fig. 1). By 2000, about 67000 immigrants moved into this county for off-site development1. Due to the environmental effects of human LUCC activities, organic productivity in northwestern Guangxi declined. After 2000, the ecological environment was improved due to the implementation of ecological restoration policies (Zhang et al., 2010). The Grain for Green Program was implemented in Huanjiang County (Chen et al., 2018; Hu et al., 2017), where 217.33 km2 of farmland was converted to forest, involving 128 villages and 37353 plots of artificial afforestation during 2002-20122. The comprehensive control of rocky desertification has been carried out in different watersheds (Tong et al., 2018). During 2008-2010, 8762.2 ha of closed hills for afforestation, 64.2 ha of artificial afforestation, and 125.6 ha of artificial grass planting were cumulatively completed in the Renhe, Sancai, Hanwen, Guzhou, Caixia and Dongmei small watersheds3. Similarly, 339.2 ha of closed hills for afforestation, 273.8 ha of artificial afforestation, 46.6 ha of artificial grass planting were cumulatively completed in the Zhongnan, Mulun, Keai, Shandong and Yuhuan small watersheds during 2011-20133, yielding a total area of karst land that has been controlled and governed of 328.63 km2.
2.2 Data
2.2.1 NPP data
The MODIS annual NPP product (MOD17A3H) for 2008-2013 with a spatial resolution of 500 m was used in this study. This product has been thoroughly evaluated and used widely with an error rate of less than 9%, and its spatial and temporal patterns were consistent with similar products at globally representative locations and time periods (Turner et al., 2006a; Turner et al., 2006b; Zhao and Running, 2010; Hasenauer et al., 2012; Bastos et al., 2013; Zhao et al., 2015). We transformed the NPP products into the Albers Equal Area conic projection and removed the pixels with NPP values exceeding three times the standard deviation range.
2.2.2 Land cover data
As the input data for producing the MODIS annual NPP data, we used the land cover type 2 data (i.e. annual University of Maryland classification, referred to as UMD datasets) from the MCD12Q1 products (https://lpdaac.usgs.gov/) with a resolution of 500 m. These data have been evaluated through stepwise verification and comparison with data and products from other sensors (e.g., AVHRR, MISR, TM/ ETM+; https://landval.gsfc.nasa.gov/background.html). The overall accuracy of cross-validation for this product is 75% (Friedl et al., 2010), and relevant verification works have been implemented previously in China. It has a high consistency with other land cover datasets and an overall accuracy of over 70% (Liang et al., 2015; Cao et al., 2016; Yang et al., 2017). We reclassified the land cover products for 2005, 2008, 2011 and 2013 into seven types (i.e. water, forests, shrublands, grasslands, croplands, urban, and barren) according to the corresponding relationships between them (see Table 1), and converted them to Albers projections (Fig. 2). We also collected another land cover dataset for 2005 and 2011, with a spatial resolution of 30 m, for quantifying the sensitivity of the LUCC contribution to different LUCC data (http://www.dsac.cn/DataProduct/Detail/200804). Data with an accuracy of over 75% and kappa coefficient over 0.65 were produced by visual interpretation and based on satellite imagery (Liao et al., 2018). The data were resampled (Nearest neighbor) to the spatial resolution of 500 m, and were then transformed into the Albers projection and reclassified to match the MODIS land cover data.
We used the daily surface climate and Global Historical Climate Network data for 2008-2013 with a spatial resolution of 250 m (ftp://ftp.ncdc.noaa.gov/pub/data/ghcn/daily) to produce the annual climate data (i.e. temperature, precipitation and radiation) using ANUSPLIN software (Wang et al., 2017a). These data were significantly linearly related to the climate data of the flux observation stations with fitting R-square values for temperature and precipitation of 0.94 and 0.67, respectively. Then we transformed the data into the Albers projection and clipped them using the administrative map of Huanjiang County.
2.2.4 Auxiliary data
We generated the total atmospheric nitrogen deposition data for 2008 and 2013 using wet nitrogen deposition and the ratio (Yu et al., 2019) of total nitrogen deposition and wet nitrogen deposition (Jia et al., 2019) to analyze the relationship between total atmospheric nitrogen deposition and NPP. CO2 concentration data were obtained online from Mauna Loa Observatory (https://www.esrl.noaa.gov/gmd/ccgg/trends/).
Figure 2.
Land use classification and mapping in Huanjiang County in (a) 2008 and (b) 2013
We used the NPP dynamic index (K) defined in Fu et al. (2013) to quantify the change of NPP in each grid cell. The index K was calculated by the following equation:
where NPP2 and NPP1 are NPP values for each grid cell at the end and the beginning of the study period, respectively, and $\overline{NPP}$ is the mean value of NPP during this period.
For each land-use type in the grid cells, the total amount of NPP change (∆NPPT) can be attributed to three components: LUCC, the environmental comprehensive factor (referred to as ECF, including climate, atmospheric CO2 concentration, atmospheric nitrogen deposition, and related factors) and the interaction between them, as shown in equation (2) (Fu et al., 2013).
$$
where S1 and S2 are the areas of a given type of land use in 2008 and 2013, respectively, and $\Delta S$ (i.e. S2-S1) is the value of the area change of the corresponding land type during 2008-2013. npp1 and npp2 are the NPP average values corresponding to the unit area of that land type in 2008 and 2013, respectively, and Δnpp (i.e. npp2-npp1) is the change in NPP during 2008-2013. The relative contributions of changes in land use and land cover (${{\partial }_{LUCC}}$), environmental comprehensive factor (${{\partial }_{ECF}}$), and their interaction (${{\partial }_{LUCC\And ECF}}$) to the overall change in NPP for each grid cell are calculated by equations (3)-(5) (Fu et al., 2013).
The effects of these three factors on NPP in grid cell i (Ei) can be expressed by the product of their relative contributions and the dynamic index Ki.
where ratex is the area ratio of the NPP affected by the factor x (i.e. the weight of the impact range).
3 Results
3.1 Temporal and spatial variation of NPP
The average annual NPP in Huanjiang County increased from 619.99 gC m-2 in 2008 to 716.73 gC m-2 in 2013 (Fig. 3a). This NPP increase occurred in 95.5% of the county area with a normal distribution (Fig. 3c-d). Specifically, NPP increased in both non-rocky desertification area (NRDL) and potential rocky desertification or rocky desertification area (P/RDL), with increments of 16.01% and 13.86%, respectively (Fig. 3b). Annual NPP in both NRDL and P/RDL show bimodal distributions. The frequency of high NPP values in NRDL is greater than in P/RDL, while the low values are distributed more in the latter than in the former (Fig. 3b). The NPP dynamic index (K) in this county ranged from -0.36 to 0.64, with a mean of 0.153, during the period of 2008-2013. According to the quartiles of K, we divided the NPP change into four groups, i.e. decreasing or extremely slightly increasing (-0.36≤K<0.09), slightly increasing (0.09≤K<0.15), moderately increasing (0.15≤K<0.21), and obviously increasing (K≥0.21). In areas where NPP increased obviously, the K-mean in NRDL is significantly higher than in P/RDL (P<0.01).
Figure 3.
NPP changes in Huanjiang County during 2008-2013. (a) Distribution of NPP values in the county, (b) Distribution of NPP values in non-rocky desertification area (NRDL) and the potential rocky desertification or rocky desertification land (P/RDL); (c) Distribution and (d) spatial pattern of the NPP change index (<italic>K</italic>). Red dots are the averages.
In the whole county, the NPP dynamic index (K) attributed to LUCC is 3.9%, with a relative contribution of 25.23% to the NPP change. LUCC increases the NPP by 10.5% in areas where LUCC occurs, with a relative contribution of 70.97% (Table 2). During 2008-2013, 748.3 km2 of grasslands were converted into forests, and farmlands were mainly converted to grasslands (104.75 km2) and forests (18.03 km2). The net increase in forests was 171.51 km2 (Table 3). The region with obviously increased NPP (K≥0.21, the third quartile of NPP change index) is mainly distributed in the northeast of Huanjiang county (Fig. 3d), where LUCC has an overall relative contribution to the NPP increase of 19.89%. For the areas where LUCC occurs in this region, the total effect of LUCC on NPP (0.059) is higher than ECF (0.019; Fig. 4d).
Figure 4.
Spatial patterns of effects of (a) LUCC, (b) ECF and (c) their interaction on NPP, and (d) statistics for the total effect of factors on the |<italic>K</italic>|≥0.21 (i.e. the third quantile of the NPP change index) area.
Statistics of K that are attributed to land use and land cover change (referred to as LUCC), the environmental comprehensive factor (ECF), and their interaction.
We then compared the differences in K between the six small watersheds (i.e. Dongmei, Guzhou, Caixia, Hanwen, Sancai, and Renhe small watersheds) where the RDCP has been implemented during 2008 to 2010, and the adjacent buffer areas outside of them. Since Dongmei, Guzhou, and Caixia small watersheds are geographically connected, as are Sancai and Hanwen small watersheds (Fig. 5a), we grouped these small watersheds into three regions and established a 1 km buffer outside of each region (Fig. 5a). The RDCP mainly included three vegetation restoration measures, i.e. closing hills for afforestation, artificial afforestation, and artificial grass (Fig. 5b-g). The results show that the rate of NPP increase in the vegetation restoration measure region was significantly higher than in the buffer region outside the RDCP region (Table 4). Overall, the mean of K increased with the implementation area of the vegetation restoration measures, except for in Sancai (y=0.0041x+ 0.0734; R2=0.84; P<0.05).
Figure 5.
Spatial distribution of (a) RDCP (see <xref ref-type="fig" rid="F1">Fig. 1</xref>) and (b-g) vegetation restoration measures (referred to as VRM; i.e. closing hills for afforestation, artificial afforestation, and artificial grass) in each of the six small watersheds
ECF caused an increase in NPP with a K of 0.106, i.e. a relative contribution of 69.61% to the NPP change in the whole county during 2008-2013 (Table 2). Compared to the climate in 2008, there was a decrease in annual precipitation by 331.02 mm in 2013. We inferred that the observed NPP increase was mainly associated with the rising temperature (+0.49 ℃) and enhanced radiation (+292.23 MJ m-2), and the increases in both CO2 concentration (+10.92 ppm) and atmospheric nitrogen deposition (+4.92 kg N ha-1) during this period. For the areas in which LUCC occurred with a mean K of 0.148, ECF contributes 14.51% to the increase in NPP (Table 2). For the region where |K|≥0.21 with a mean K of 0.267, ECF increased NPP by 0.197 (Table 2). The area where NPP increases was greatly affected by ECF and is mainly located in the northeast of Huanjiang County (Fig. 4b), where pixels with an R2 for the multiple regression of NPP and climatic factors (precipitation, temperature, radiation) exceeding 0.8 account for 66.6% and 19.8% of them, and they are significant at the 0.05 level. On average, NPP was most significantly affected by radiation changes (NPP=0.26×radiation+51.42; R2=0.705, P<0.05) among the three climatic factors. In this region, radiation increased by 361.87 MJ m-2 during 2008-2013. For the area where LUCC occurred in this region, the total effect of ECF on NPP (0.019) was much lower than it was outside the LUCC area (0.179; Fig. 4d). Compared to the individual effects of ECF and LUCC on NPP changes, their interaction had only a small effect on NPP, which caused a change from -0.07 to 0.09 (Fig. 4c).
Regions
K
Watersheds
K of VRM
Areas (km2)
VRM
Non-RDCP
Region 1
0.174*
0.161*
Guzhou
0.151
18.43
Dongmei
0.131
13.16
Caixia
0.208
29.26
Region 2
0.128**
0.106**
Sancai
0.108
27.41
Hanwen
0.162
26.08
Region 3
0.137**
0.078**
Renhe
0.137
15.73
Table 4.
Comparison of the NPP dynamic index (K) values between regions with the implementation of vegetation restoration measures and 1 km buffer areas outside of those governance regions in the six small watersheds
We conducted a sensitivity analysis to examine how the estimated contribution of LUCC to NPP would be affected by the selection of land use data. We calculated the relative contributions of LUCC, ECF, and their interaction to the NPP change in the region with obviously changed NPP. This calculation was based on the third quartile of the NPP change index (|K|≥0.21 during 2008-2013; |K|≥0.23 during 2005-2011) using the land use data interpreted by TM images in 2005 and 2011 (referred to as S1), and MODIS UMD land cover data in the same period (referred to as S2) as shown in Fig. 6, where S0 represents the results using MODIS UMD land cover data in 2008 and 2013. The sensitivity analysis results show that the relative contribution of LUCC on NPP changes from 18.56% (S2) to 8.14% (S1) due to the selection of different land cover data (Fig. 6). This decrease in the LUCC’s contribution mainly results from the area of land use change in S1 being smaller than that in S2, thus NPP was affected less by LUCC in S1.
Figure 6.
The relative contributions of LUCC, ECF change and their interaction on NPP changes in the region with obviously changed NPP, i.e. the third quantile of the NPP change index (|<italic>K</italic>|≥0.21 during 2008-2013; |<italic>K</italic>|≥0.23 during 2005-2011).
Note: S0 and S2 represent the results by using MODIS UMD land cover data during 2008-2013 and 2005-2011, respectively; while S1 represents TM image-based land use data during 2005-2011.
4 Discussion
Our results show that the NPP in most areas of Huanjiang County had an increase during 2008-2013, and LUCC related to vegetation restoration measures provided an important contribution (25.23%) to it, especially in the LUCC area (70.97%). The implementation of the rocky desertification control project since 2008 promoted the increase of NPP in the governed watersheds of the south and southwest of Huanjiang County. Table 4 provides strong proof that the increase of NPP in the governed karst areas was significantly higher than that in its neighboring ungoverned karst areas. In addition, 748.3 km2 of grassland was converted into forests, while 104.75 km2 and 18.03 km2 of farmlands were converted into grasslands and forests, respectively. The green restoration measures (i.e. closing hills for afforestation, artificial afforestation, and artificial grass; Fig. 5b) in the RDCP region can increase vegetation productivity either directly or indirectly. The measures of artificial afforestation and artificial grass can effectively adjust soil bulk density and porosity, increase soil water retention capacity, and improve the soil physical structure to provide better resistance to erosion (Sun et al., 2013). The measure of closing hills for afforestation can increase litter input and change the soil microbial composition, which lead to further improvement in the soil nutrient conditions (Xiao et al., 2015; Fan et al., 2019). Vegetation recovers quickly and its coverage increases dramatically (Tong et al., 2017; Brandt et al., 2018), which leads to large positive trends in aboveground biomass and carbon sequestration (Zhang et al., 2015). In addition, the government of Huanjiang County has continued to carry out the RDCP. For example, 339.2 ha of closed hills for afforestation, 273.8 ha of artificial afforestation, and 46.6 ha of artificial grass planting have been completed collectively in the Zhongnan, Mulun, Keai, Shandong and Yuhuan small watersheds during 2011-2013; while 700 ha of closed hills for afforestation, 300 ha of artificial afforestation, 53.3 ha of artificial grass planting have been completed collectively in the Jingyang, Mulun, Bochuan, Xiyuan, Tangba, Yifeng small watersheds during 2015-20174. These ongoing efforts may result in a continuous increase in NPP from the southeast to southwest of Huanjiang County in the future.
The NPP change was also associated with changes in climate, CO2 concentration, and atmospheric nitrogen deposition. The increases in radiation and temperature during 2008-2013 in Huanjiang County might be two key climatic factors for stimulating the canopy photosynthesis rate and NPP. Generally, solar radiation is an important climatic factor limiting vegetation growth in southern China (Nemani et al., 2003; Wang et al., 2017b). Therefore, the significant increase in radiation will benefit vegetation growth by providing more sunlight and optical energy for photosynthesis. In addition, the initial restoration of karst ecosystems in China is mainly limited by the element N, so the increased soil nitrogen uptake due to the restoration of artificial vegetation (Liu et al., 2018) and the increase of atmospheric nitrogen deposition can provide more compounds that can be utilized for photosynthesis (Tipping et al., 2019). As one of the raw materials for photosynthesis, the increase of CO2 concentration promotes vegetation growth, and the increased leaf area can amplify the effect of higher CO2 levels on vegetation carbon accumulation (Luo and Niu, 2020). Further quantification of the individual contributions from these environmental factors will require the utilization of process-based models by conducting multi-factor simulation experiments.
The effect of the interaction between LUCC and ECF on NPP was relatively limited in this study, as it increased NPP by only 0.008 in Huanjiang County from 2008-2013. LUCC and ECF may have either synergistic or antagonistic effects on productivity. A positive interaction (i.e. synergy) indicates that NPP can better adapt to an ECF change due to land use change. Conversely, a negative interaction (antagonism) indicates that the ECF change prevents NPP from responding to land use change. The results show that the synergy, with an increase (i.e. +0.00799) of NPP in 95.84% of Huanjiang County, offset the antagonism, with a decrease (i.e. -0.00009) of NPP in 4.16% of the area from 2008-2013, resulting in a small but positive net interaction (+0.0079) on NPP. On the one hand, the increase in forests due to the Grain for Green Program reduced the surface albedo (Xiao et al., 2011), which caused more radiation to be absorbed by vegetation and increased NPP (Otterman et al., 1974; Charney et al., 1975; Sagan et al., 1979). On the other hand, the increase in temperature and the decrease in precipitation during 2008-2013 degraded the arid surface, which decreased vegetation cover and NPP (Nicholson et al., 1998; Lambin et al., 2006; Yan et al., 2013).
This paper presents a simple and feasible method for quantifying the effect of LUCC on NPP changes, which could provide a useful way to assess the effect of ecological restoration projects on ecosystems in all the karst areas of southwest China and elsewhere following the implementation of ecological restoration projects. The Chinese government has launched a new round of rock desertification control during 2016-2020, which aims to control karst land area of more than 50000 km2, to control rock desertification area of more than 20000 km2, and to plant and protect 195×104 ha of forest and grass5. Large-scale implementation of this project will lead to many positive LUCCs, which are expected to have a great effect on the improvement of the ecosystems. This study shows that the investment of the project funds in a region with suitable climatic conditions has positive ecological benefits. Further exploring the effect of LUCC caused by a new round of RDCP on ecosystems using the method of this paper on a larger scale would provide guidance for decision makers. Furthermore, to better quantify the role of ecological restoration projects in ecosystem changes, we need to make greater efforts in four areas: improving the accuracy of land use change products, collecting more data on engineering areas and their impacts on the ecosystems, understanding the impact of project implementation on ecosystem processes, and enhancing the ability to simulate those processes in existing models.
5 Conclusions
We evaluated the effect of LUCC on NPP changes in Huanjiang County during 2008-2013 using MODIS land cover and NPP data. We found that the average NPP in Huanjiang County was increasing during 2008-2013 and LUCC had an important positive contribution to this increase in NPP. Moreover, LUCC dominated the NPP change in the area with land cover changes. Such an increase in NPP, especially in the areas with marked changes, was associated with the net area increase in forests. Particularly for the regions with the implementation of vegetation restoration measures, the NPP increase was significantly greater than that in the ungoverned karst area and it increased with the implementa- tion area of the vegetation restoration measures. Our results suggested that the LUCC associated with the vegetation restoration measures might play an important role in increasing the productivity in the karst area of southwestern China. More accurate land cover data and ground-based measurements in this karst region, and the application of model simulations, are needed to better estimate the relative contributions of LUCC (especially for those changes due to vegetation restoration measures) and other environmental factors (such as climate, CO2 concentration, and atmospheric nitrogen deposition) to the vegetation change.
[2] BrandtM, Yue YM, Wigneron JP et al. Satellite-observed major greening and biomass increase in south China karst during recent decade. Earths Future, 6, 1017-1028(2018).
[7] Chen HS, Yue YM, Wang KL et al. Comprehensive control on rocky desertification in karst regions of southwestern China: Achievements, problems, and countermeasures. Carsologica Sinica, 37, 37-42(2018).
[14] HasenauerH, PetritschR, Zhao MS et al. Reconciling satellite with ground data to estimate forest productivity at national scales. Forest Ecology & Management, 276, 196-208(2012).
[15] Hu PL, Wang KL, Zeng ZX et al. Ecological stoichiometric characteristics of plants,soil, and microbes of pennisetum purpureum cv. Guimu-1 pastures at different rehabilitation ages in a karst rocky desertification region. Acta Ecologica Sinica, 37, 896-905(2017).
[16] Jia YL, Wang QF, Zhu JX et al. Spatial pattern data of atmospheric nitrogen and nitrogen deposition in China from 1996 to 2015. Chinese Scientific Data, 4, 8-17(2019).
[17] Lambin EF, GeistH, Rindfuss RR. 2006. Introduction: Local processes with global impacts. In: Lambin E F, Geist H (eds.). Land-use and land-cover change. Berlin, Germany:, Springer, 1-8.
[21] LiuX, ZhangW, WuM et al. Changes in soil nitrogen stocks following vegetation restoration in a typical karst catchment. Land Degradation & Development., 30, 60-72(2018).
[29] Sun QZ, Liu RL, Chen JY et al. Effect of planting grass on soil erosion in karst demonstration areas of rocky desertification integrated rehabilitation in Guizhou Province. Journal of Soil and Water Conservation, 27, 67-77(2013).
[34] Turner DP, Ritts WD, ZhaoM et al. Assessing interannual variation in modis-based estimates of gross primary production. IEEE Transactions on Geoscience & Remote Sensing, 44, 1899-1907(2006).
[35] Wang JB, Dong JW, Yi YH et al. Decreasing net primary production due to drought and slight decreases in solar radiation in China from 2000 to 2012. Journal of Geophysical Research: Biogeoences, 122, 261-278(2017).
[36] Wang JB, Wang JW, YeH et al. An interpolated temperature and precipitation dataset at 1-km grid resolution in China (2000-2012). Chinese Scientific Data, 2, 88-95(2017).
[46] Zhao MS, Running SW, Nemani RR. Sensitivity of moderate resolution imaging spectroradiometer (MODIS) terrestrial primary production to the accuracy of meteorological reanalyses. Journal of Geophysical Research, 111, 338-356(2015).
Mengyu ZHANG, Li ZHANG, Xiaoli REN, Honglin HE, Yan LV, Junbang WANG, Huimin YAN. Effect of Land Use and Land Cover Change on the Changes in Net Primary Productivity in Karst Areas of Southwest China: A Case Study of Huanjiang Maonan Autonomous County[J]. Journal of Resources and Ecology, 2020, 11(6): 606